Buzz
Well-Known Member
- Thread starter
- #1
I've been recording driving data for the last couple of months and finally got around to putting it all together so I can look at it today and thought I would share. I really wish this stuff was available through the app or vehicle, but oh well! I was most curious about battery consumption as a function of speed and temperature. I live in NY where we have some pretty decent swings in temp and I drive 166 miles round trip on weekdays(yeah, 83 miles one way... thank Ford for BlueCruise). When I bought Buzz, chargers were always available at the university, and free of charge. Well, there has been a major increase in plug in hybrids and other EVs on campus, so it's been a race to the chargers recently. So I have really needed to pay close attention to my efficiency. Wish I would've anticipated this when I bought it, I would've splurged on the extended range. Anyway, here's what I recorded and a really high level analysis of the data! I have not done any proper statistical analysis, just a quick visual tonight.
Vehicle is a '21 Select, AWD, SR(useable 68 kWh).
I used % battery consumed and calculated my own kWh consumed and mi/kWh. I felt like % consumed would be most reliable. I do have several other datapoints that I was recording. I'll attach the excel file at the end in case you're interested (sorted by speed, but not recorded like that. I did it for the average calculations). Sorry non-Americans, the data is all in mph and F°. I have recorded 45 trips, 83 miles each, of the exact same drive. Terrain is relatively flat.
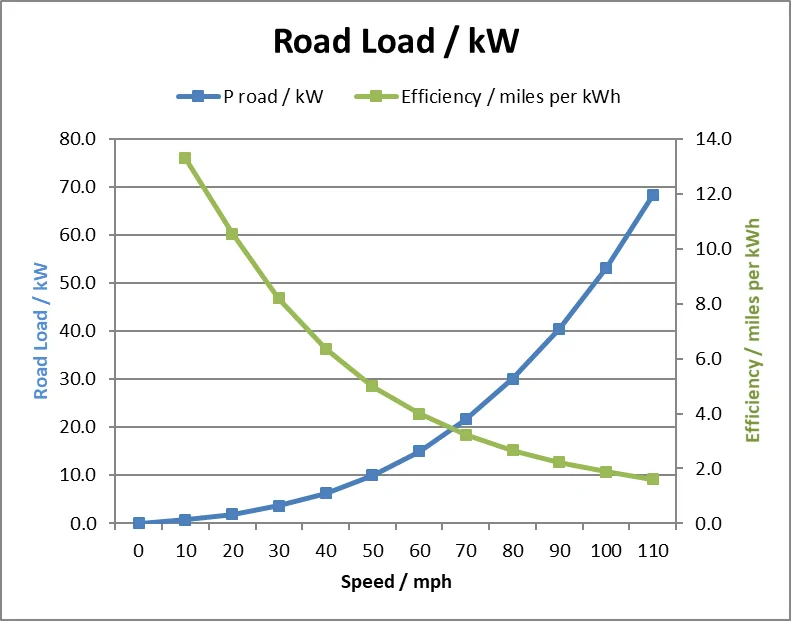
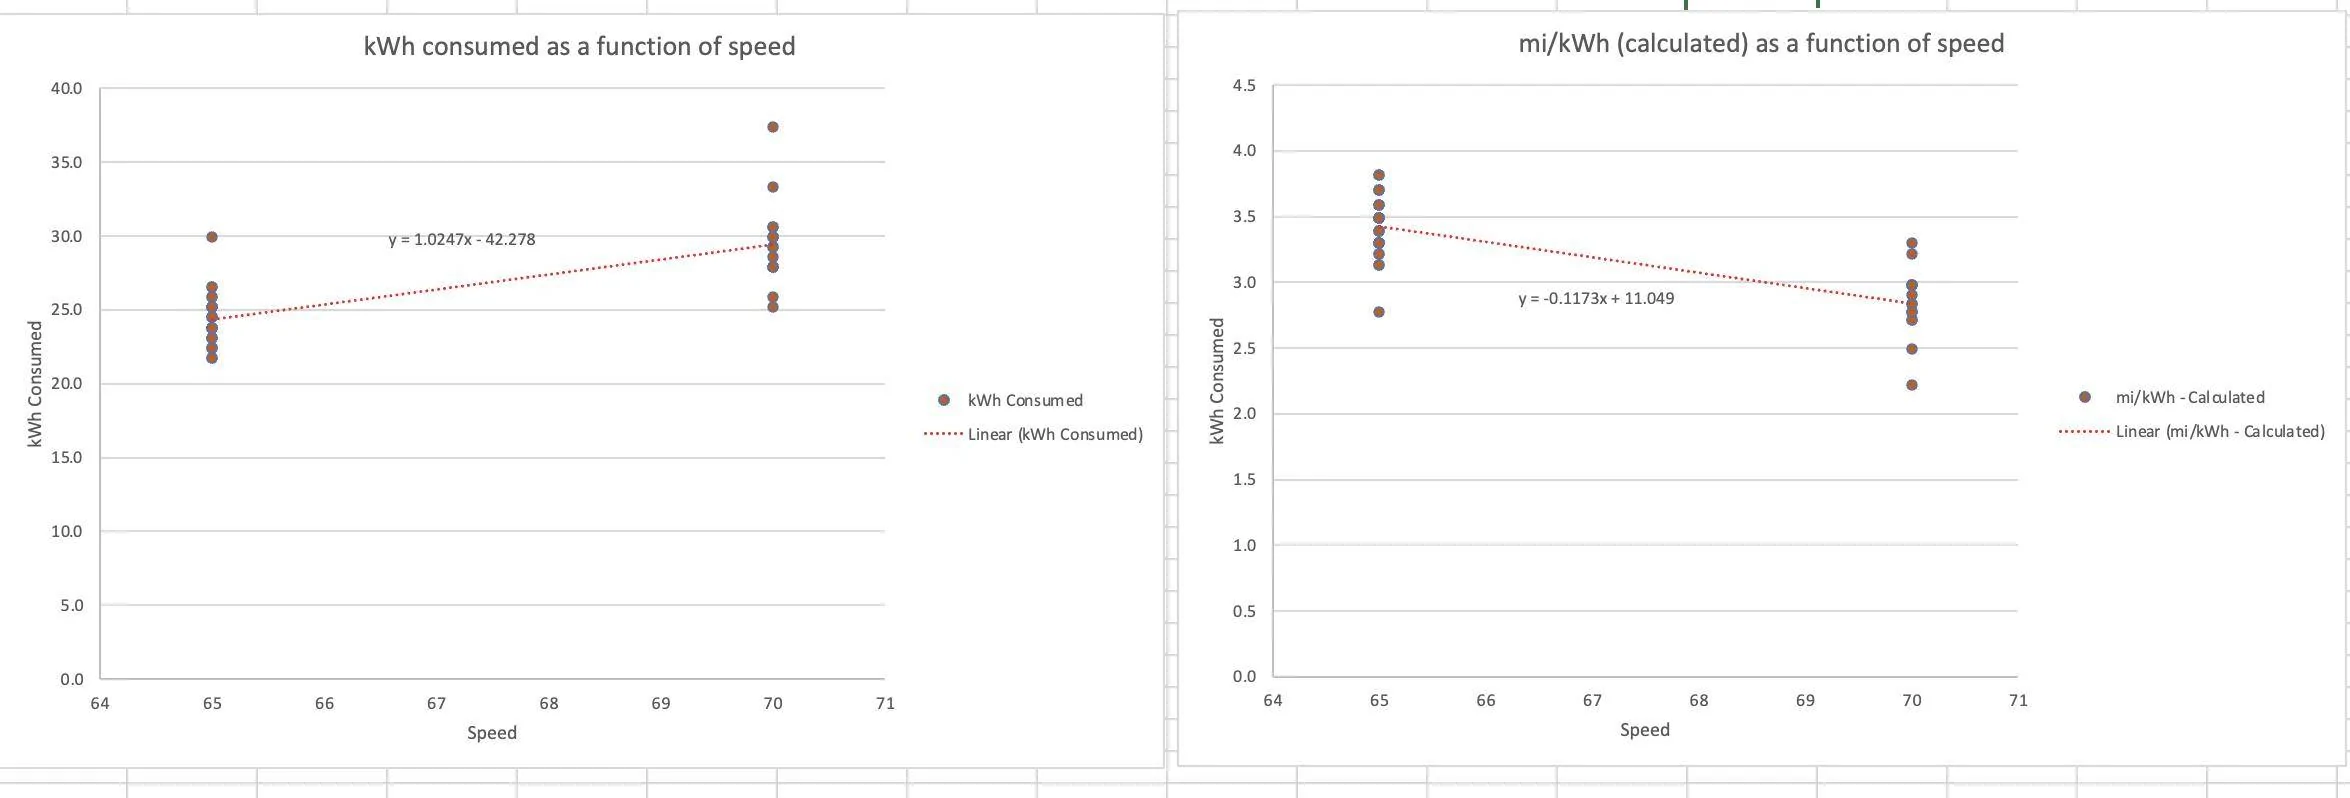
Speed - I was really surprised at the impact speed has on consumption. Obviously, the data is a little confounded by outside temp, but I was hoping to wash that out with repeats and randomization. The difference between 65 mph and 70 mph is huge! I should get ~40 miles more per full charge by doing 65mph, 3.4 mi/kWh vs. 2.8 mi/kWh. I found that really surprising! So yeah, on my daily commute, I am that guy doing 65 mph... ?

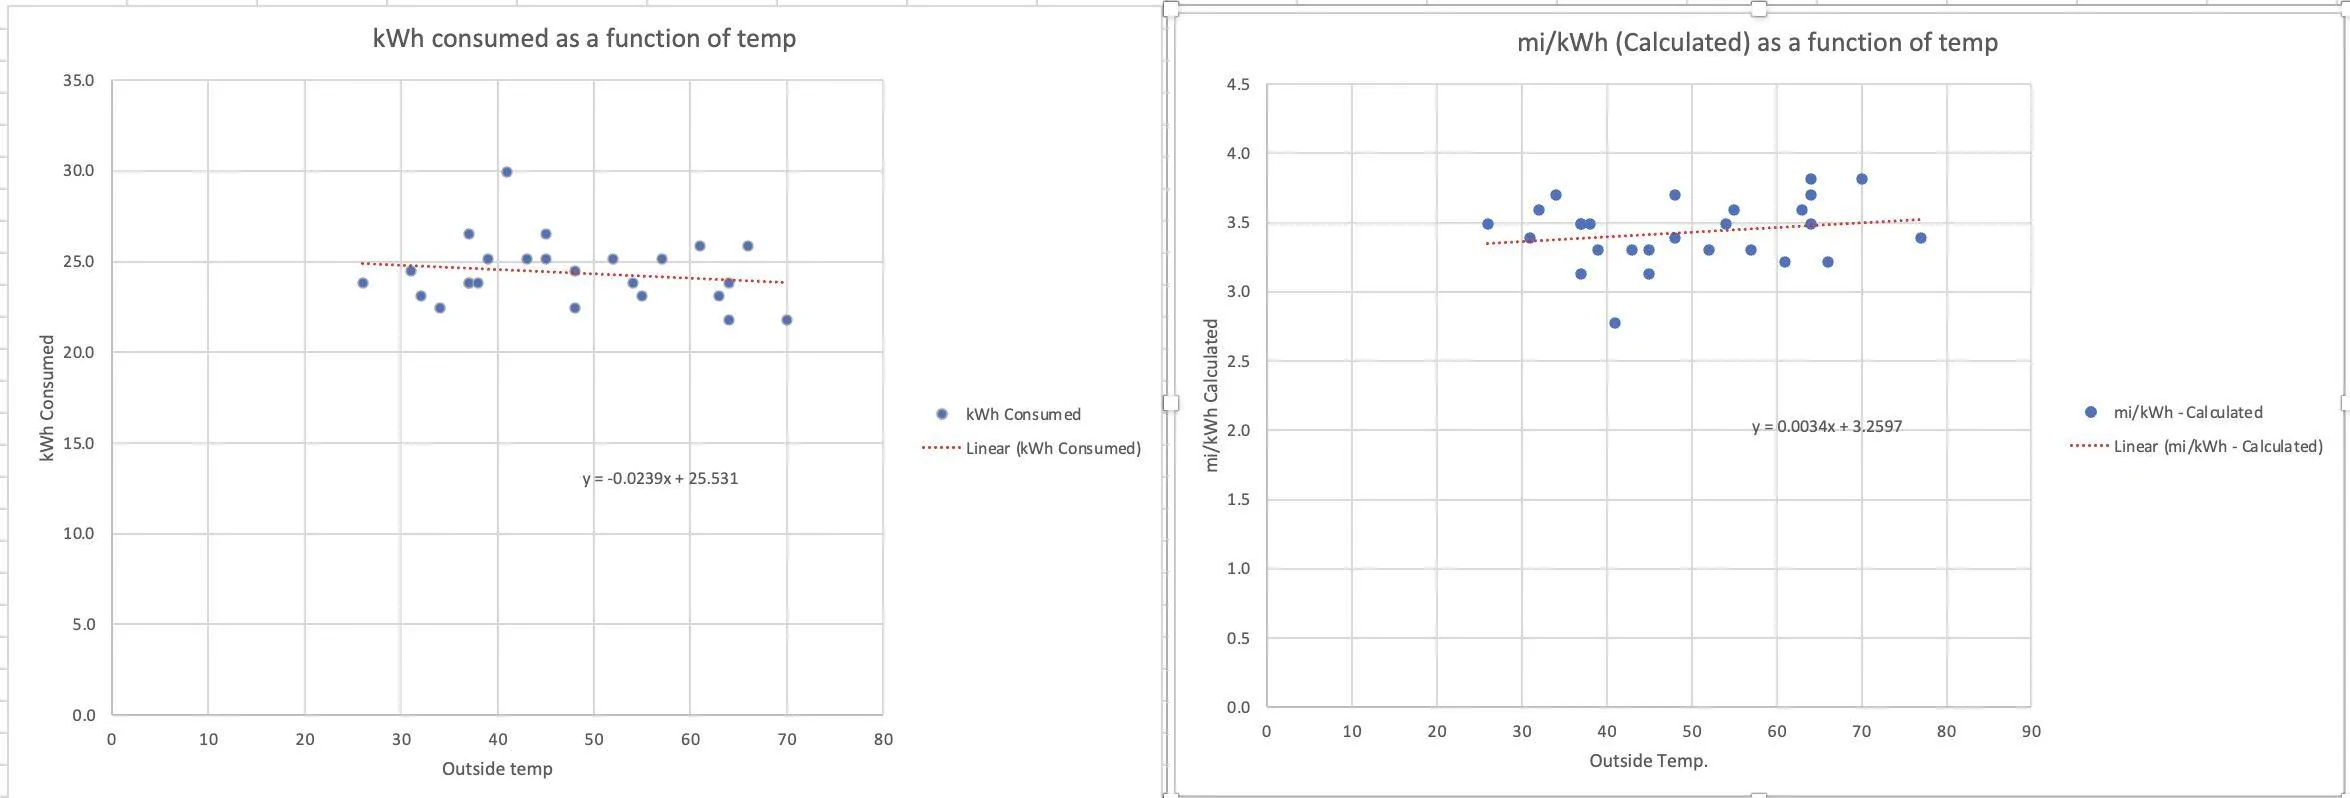
Outside Temp -This was a shock, considering what I've heard, but outside temperature doesn't seem to to be as significant of a factor in efficiency as I expected. The slope between 30 and 70 (F) is pretty minor. Though, we have colder days coming, and I don't expect it to be a linear relationship. Anyway, I used minimal climate on my trips. Again, hoping repeats and randomization will give it validity.
Here's the graph of the data at 65 mph
And here it is at 70 mph.
It does look like the efficiency could be a bit more compromised by temperature at higher speeds. Could just be coincidence though.
Yeah, so take a look. Tell me what you think. I'd be interested to hear your thoughts! I plan to keep recording, so I may send an update in another couple of months.
@Ford Motor Company , How about making this data available to us! I'd love to see it!
Vehicle is a '21 Select, AWD, SR(useable 68 kWh).
I used % battery consumed and calculated my own kWh consumed and mi/kWh. I felt like % consumed would be most reliable. I do have several other datapoints that I was recording. I'll attach the excel file at the end in case you're interested (sorted by speed, but not recorded like that. I did it for the average calculations). Sorry non-Americans, the data is all in mph and F°. I have recorded 45 trips, 83 miles each, of the exact same drive. Terrain is relatively flat.
Speed - I was really surprised at the impact speed has on consumption. Obviously, the data is a little confounded by outside temp, but I was hoping to wash that out with repeats and randomization. The difference between 65 mph and 70 mph is huge! I should get ~40 miles more per full charge by doing 65mph, 3.4 mi/kWh vs. 2.8 mi/kWh. I found that really surprising! So yeah, on my daily commute, I am that guy doing 65 mph... ?
Outside Temp -This was a shock, considering what I've heard, but outside temperature doesn't seem to to be as significant of a factor in efficiency as I expected. The slope between 30 and 70 (F) is pretty minor. Though, we have colder days coming, and I don't expect it to be a linear relationship. Anyway, I used minimal climate on my trips. Again, hoping repeats and randomization will give it validity.
Here's the graph of the data at 65 mph
And here it is at 70 mph.
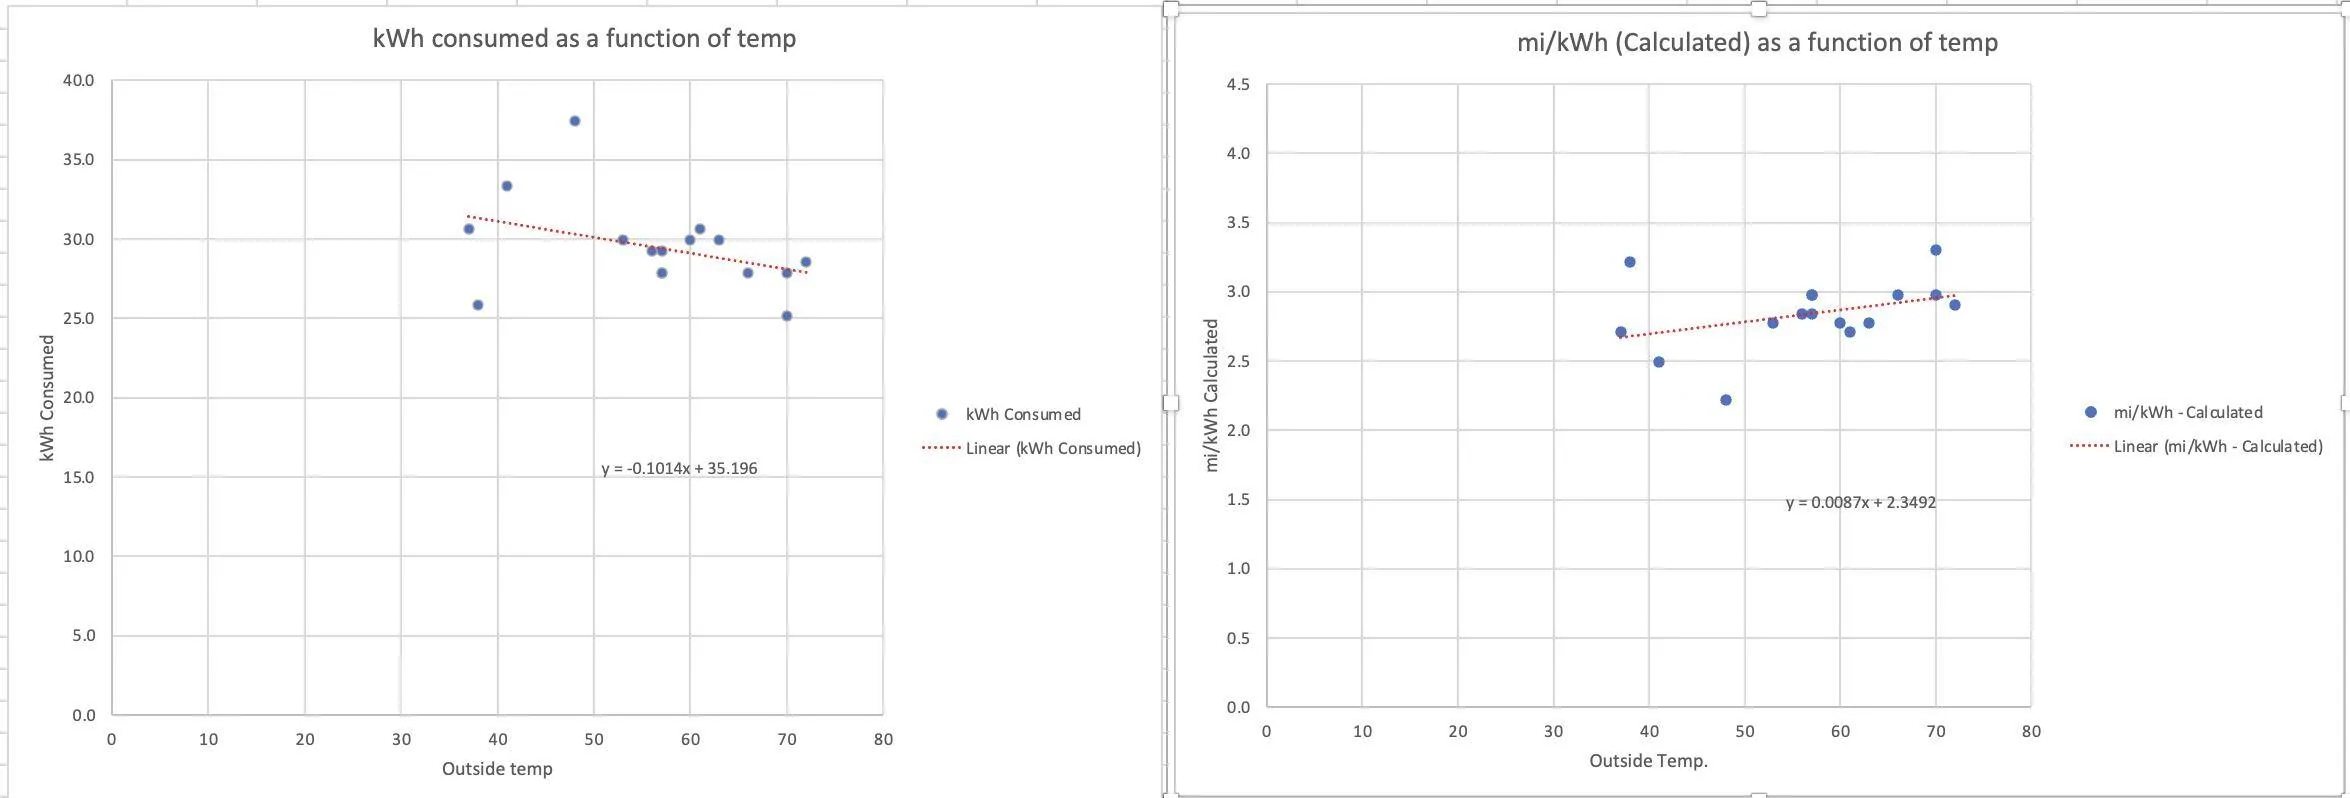
It does look like the efficiency could be a bit more compromised by temperature at higher speeds. Could just be coincidence though.
Yeah, so take a look. Tell me what you think. I'd be interested to hear your thoughts! I plan to keep recording, so I may send an update in another couple of months.
@Ford Motor Company , How about making this data available to us! I'd love to see it!
Sponsored
Attachments
-
36.8 KB Views: 156