Nklem
Well-Known Member
- First Name
- Norm
- Joined
- May 20, 2021
- Threads
- 105
- Messages
- 1,318
- Reaction score
- 1,699
- Location
- Coast of Maine
- Vehicles
- Subaru Solterra
- Occupation
- Mechanical Engineer
- Thread starter
- #1
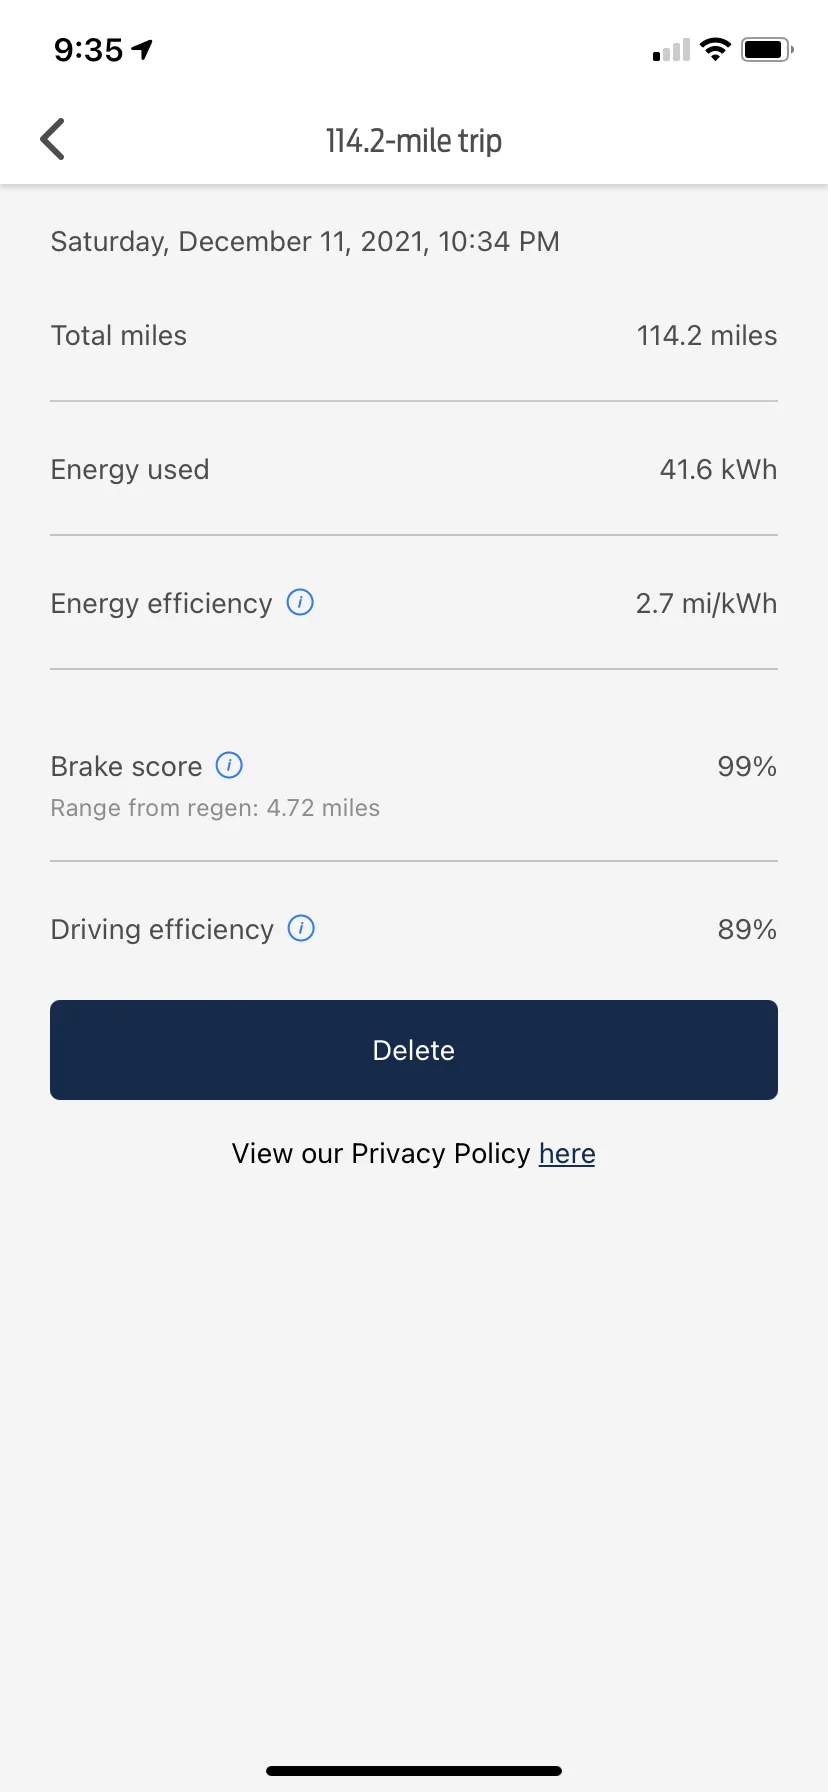
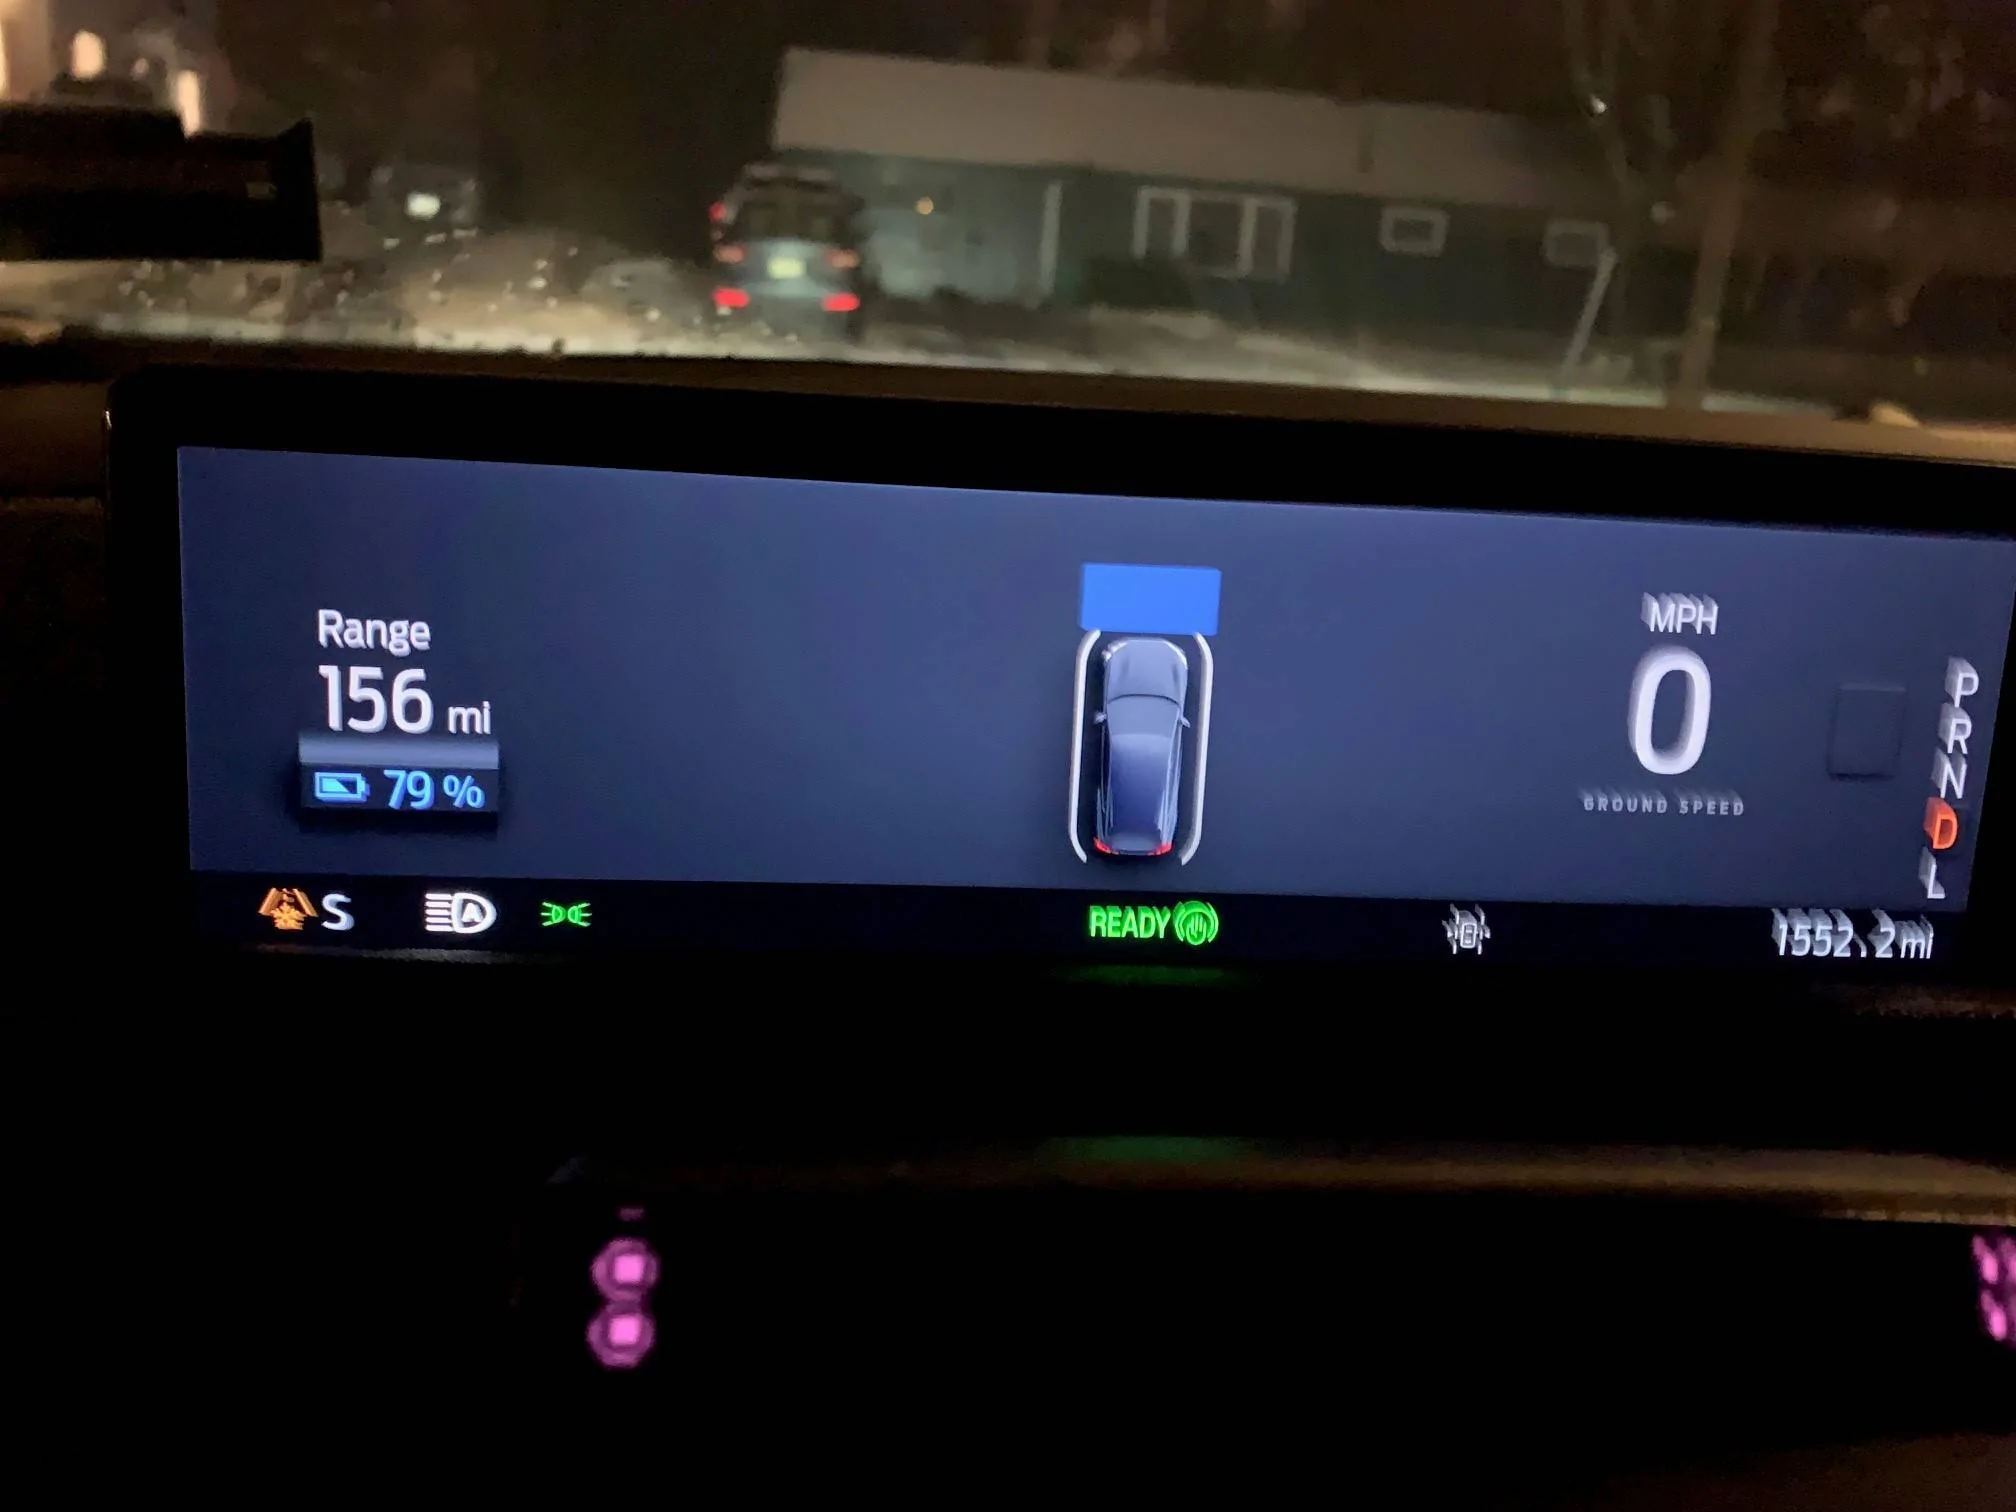
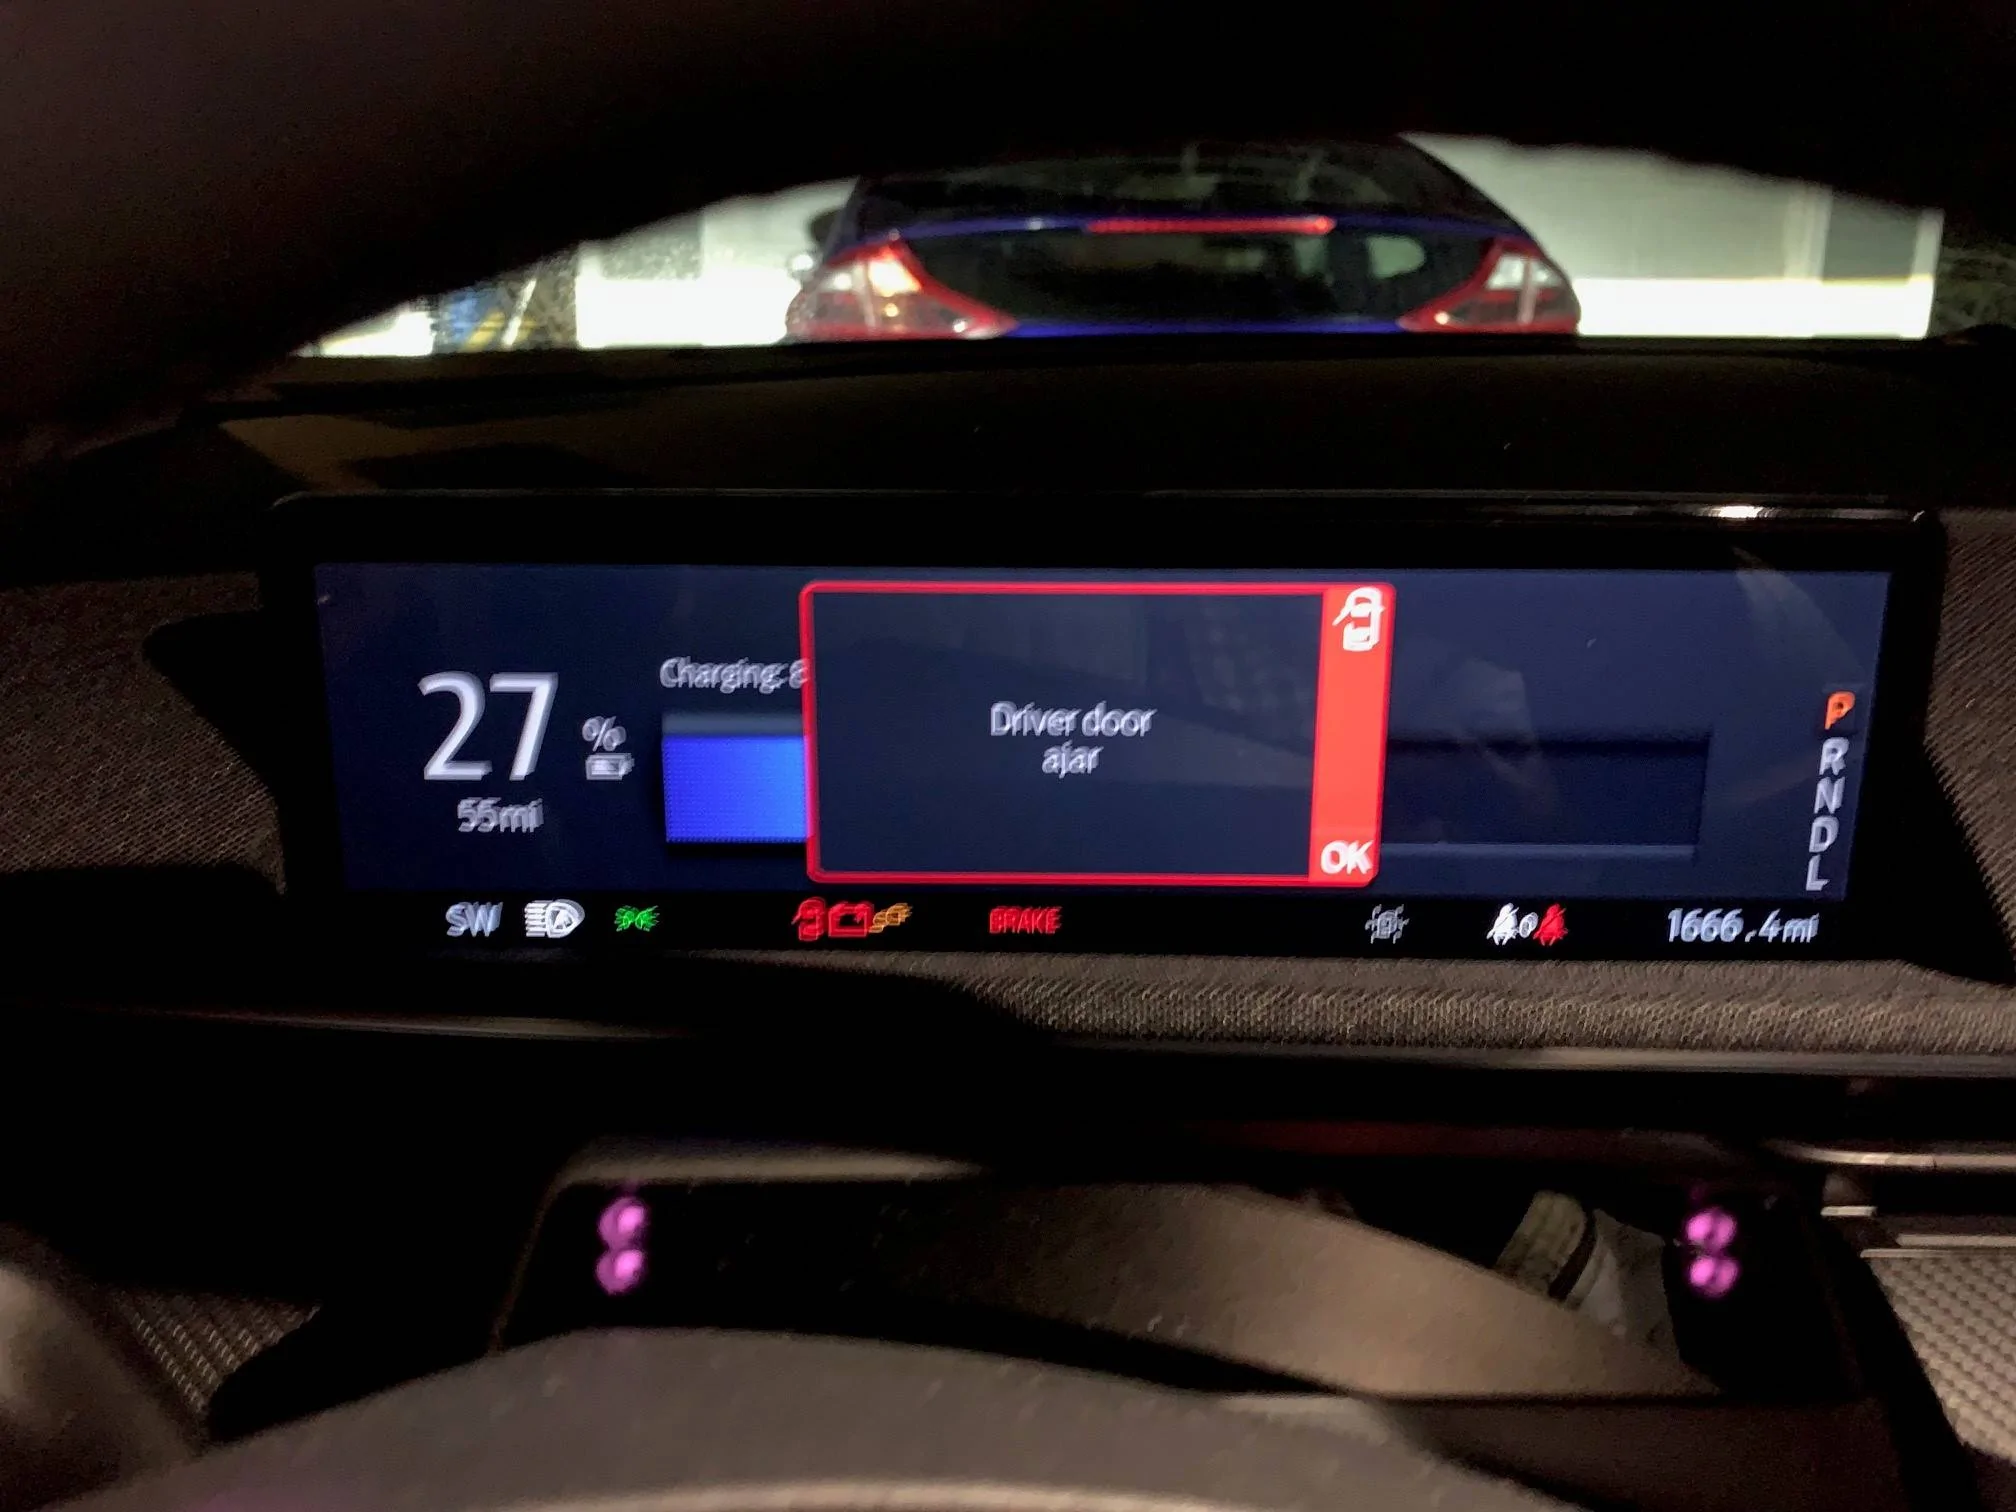
Summary: 114 mile trip . Ford Pass says I used 41.6 kWh, or 47%. By battery percentage it says I used 52% (45kWh). My charger put 53% (46 kWh) back into the battery.
So interesting results from a recent 114.2 Mile trip looking at the meter data for an ER AWD in winter. It was a mild trip for 1/2 and wintery the other half. I was crowdsourcing data.
After returning home The car took exactly 46.76 KWh to recharge from this trip back to the original starting percentage. This is the gross reported out of my ChargePoint charger (from the charger software) to the Mach E. That corresponds and matches nearly exactly to the battery percentage used for this trip 79% to 27% which is very close to 52% of an 88 KW (.52x88, Battery size) or 45.76 kWh. (So strange this came out this way a 2% or 1 kW difference). This calculates to 2.5 Mi/KWh for the trip. So only 1 kW for internal charger losses, or 2% ?
Even if I take the % as the worst case (26.5% to 79.5%), that's 46.64 kWh or the best case (27.5%-78.5%) that's 44.88 kWh. so the difference from Charged to that usage is a range of difference of 0.24% to 4.01%
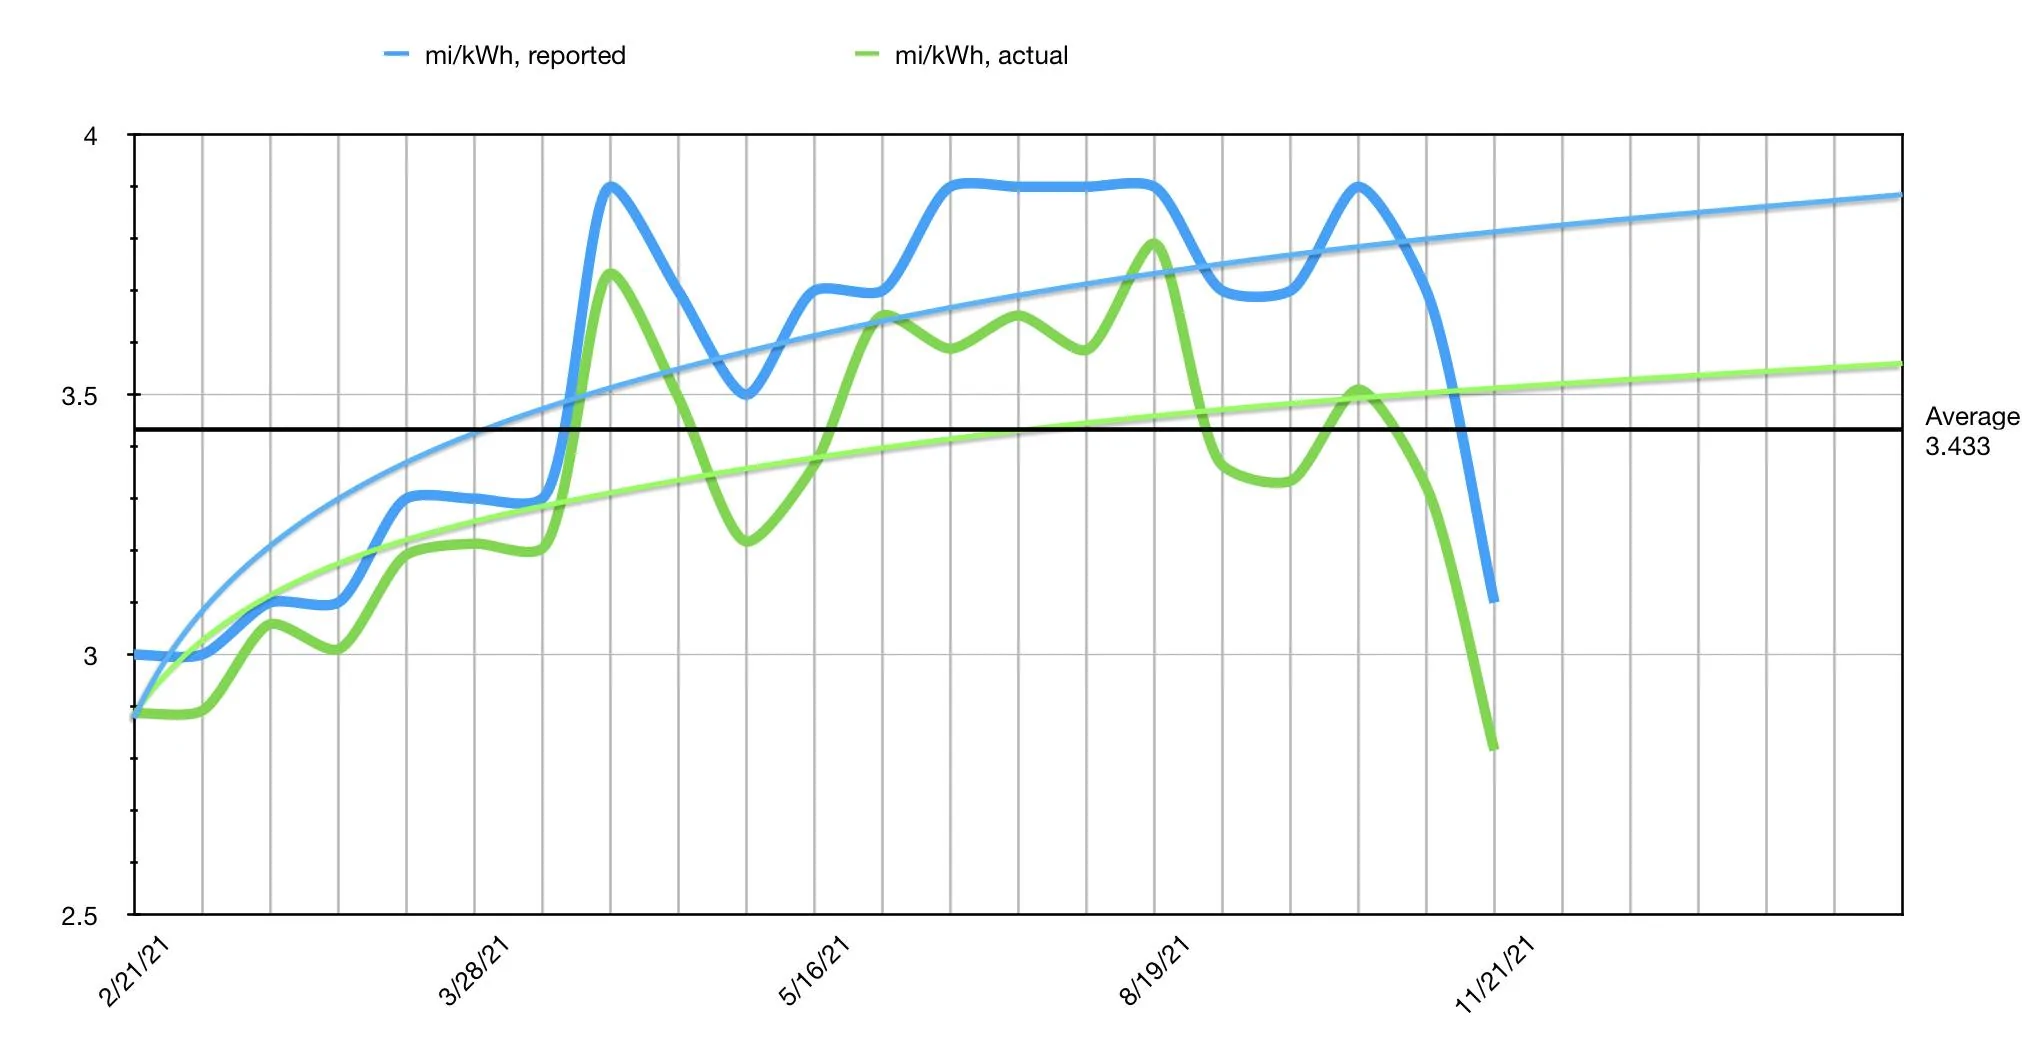
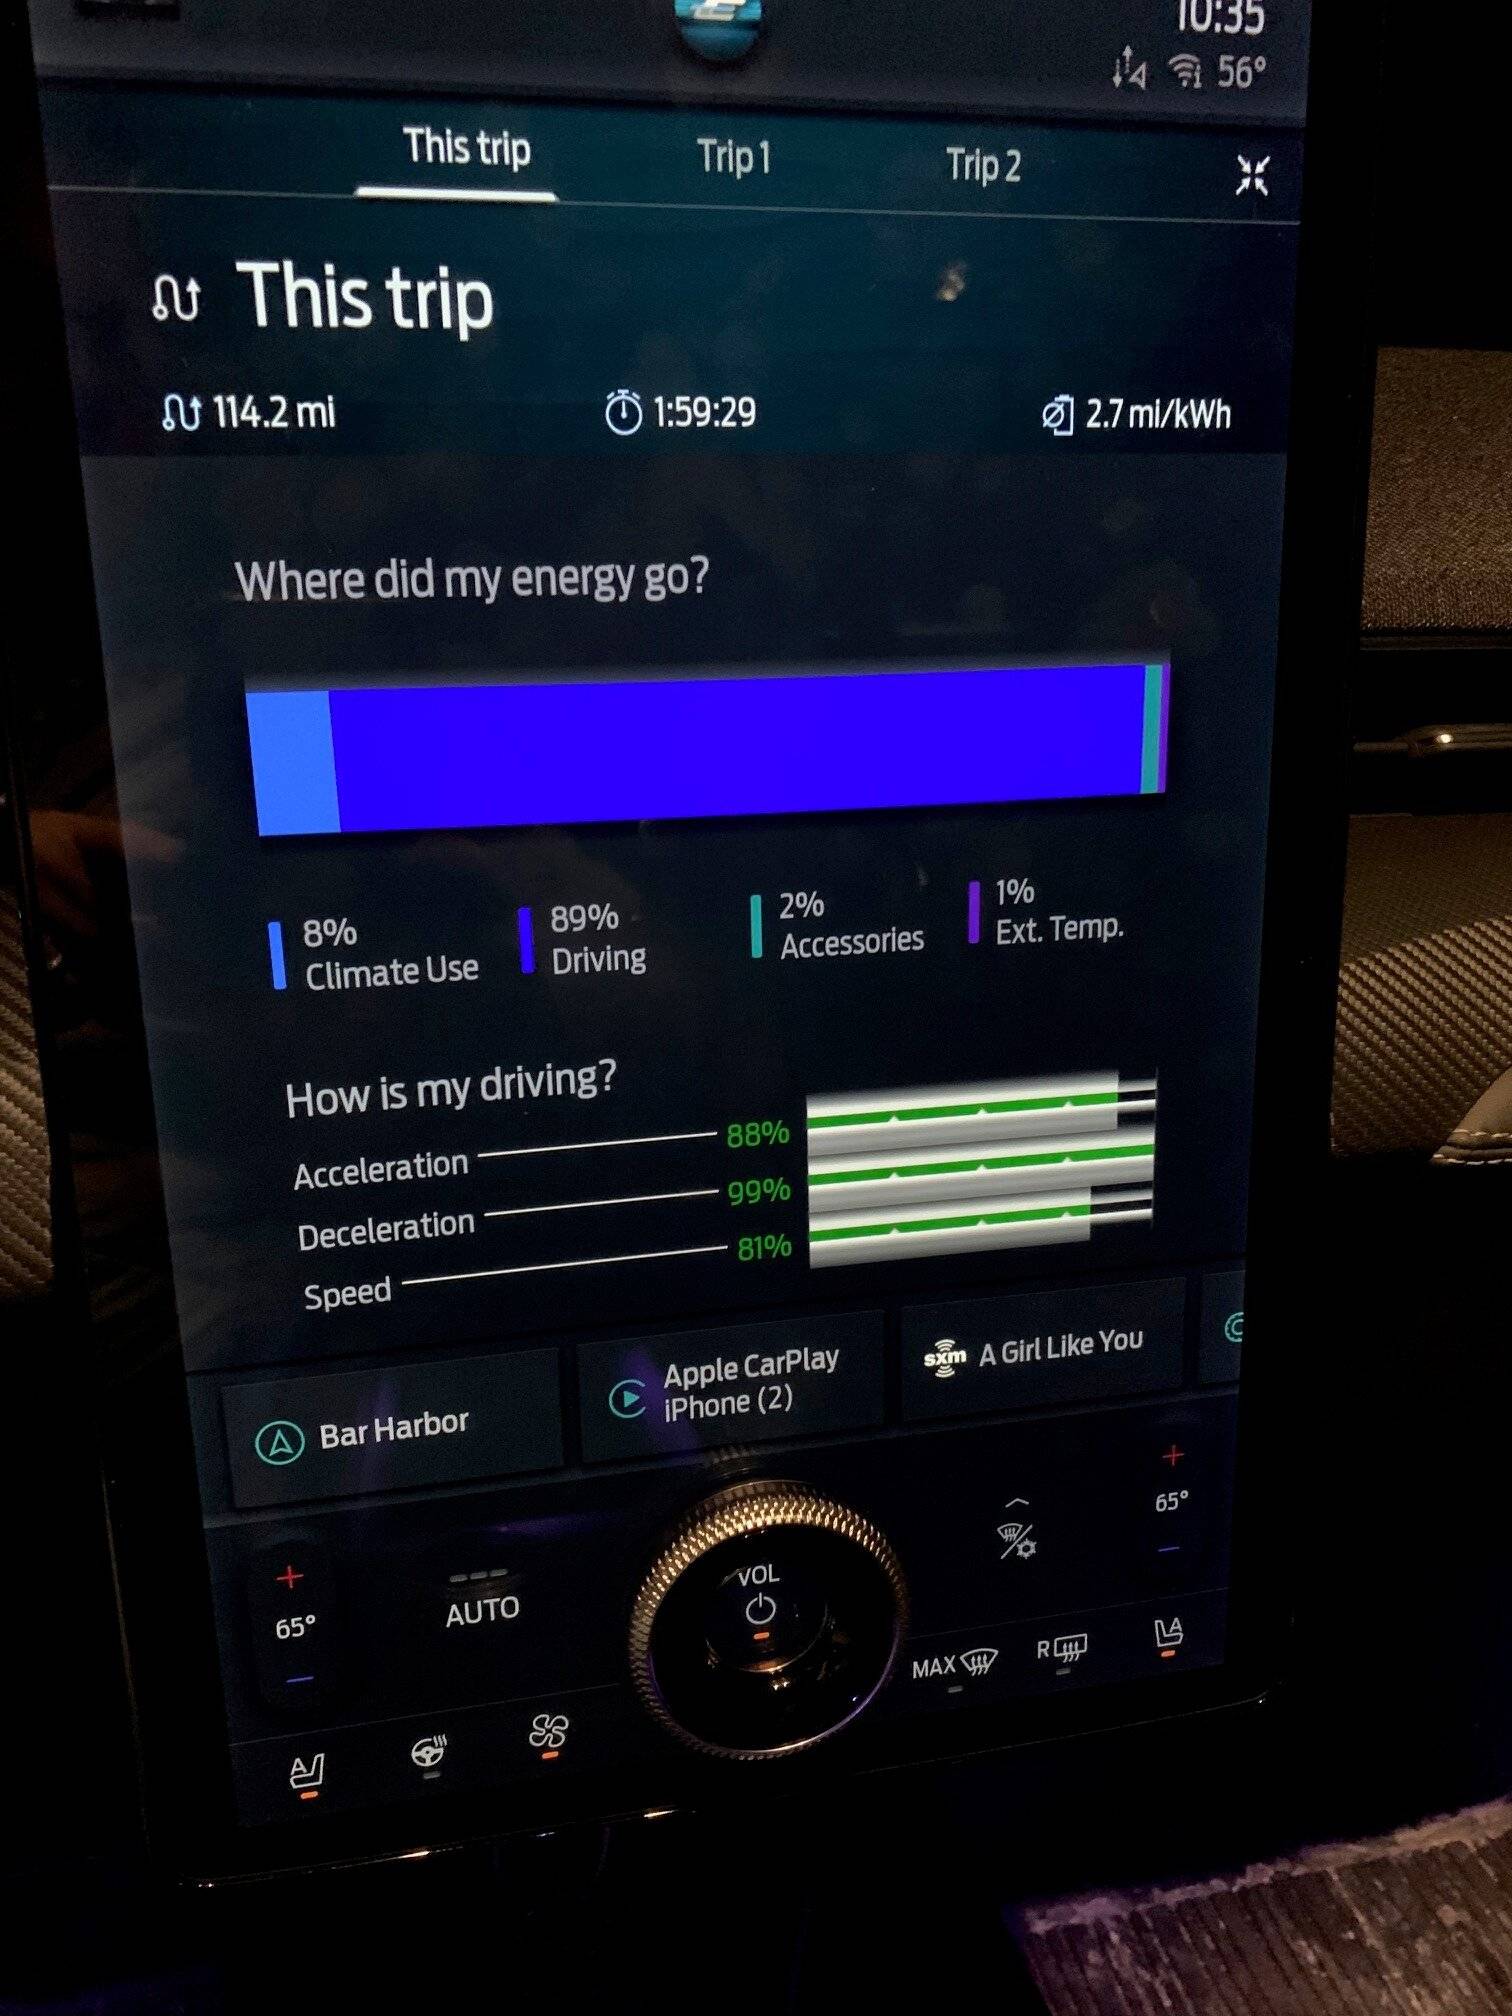
The strange thing is My EV data on FordPass shows I actually used 41.6 KWh for this trip (or 47% of the battery). If I divide the miles driven (114.2), I get the 2.7 mi/kWh reported by the car. It also notes a "driving efficiency" of 89%.
If I assume 9% for internal charger losses (What I saw on my Select for 11,000 miles and verified), that actually equals 45.7 kWh. (41.6/.91). These calcs are too close to perfect. But………
With this data working out like it is, I would have to assume the % battery display in the Mach E includes and added 9% factor for charger losses and our Mi/KWh on the display takes that factor of 9% away.
Or there are much lower charger losses in the Mach E than assumed and what came out of my ChargePoint made its way nearly lossless into the battery. We know that is not correct.
Or the battery percentage display is off by 9% (but FP reported 52% recharged to the battery last night.) I forgot to look at the charging data before we used the car today, so that is lost).
OR I guess the metering in my Chargepoint could be wrong.
Sorry, it was a boring Sunday night until Yellowstone was on, so I had some time to crunch these numbers. Sometimes being an engineer can be a burden.......
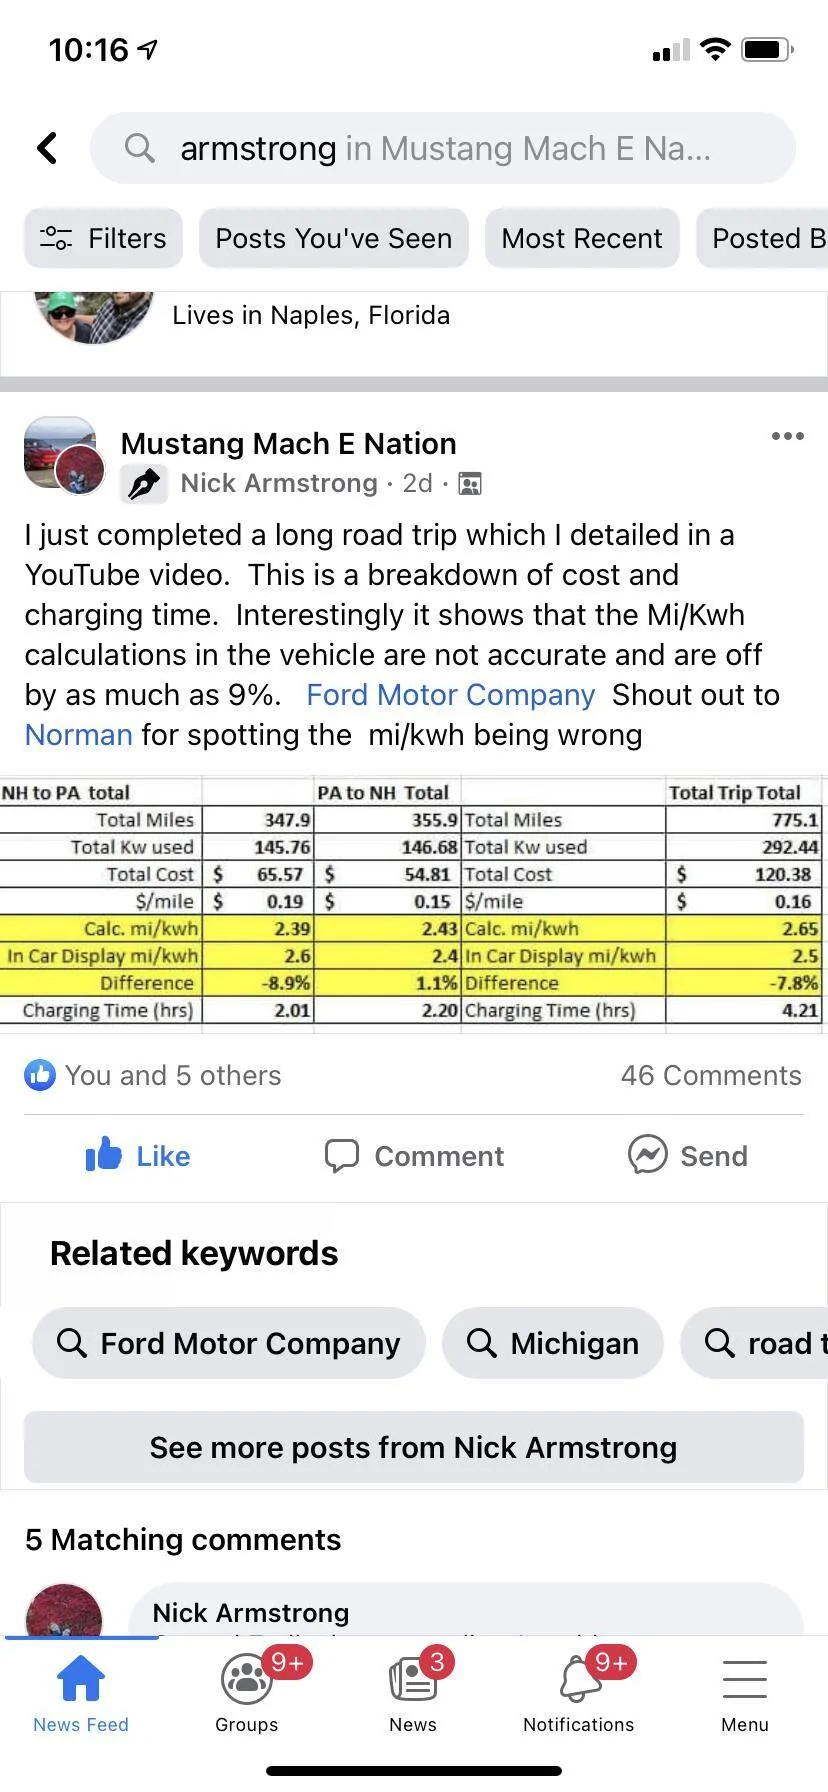
A FB Mach E Nation member Nick A found similar results on a long trip with his Select noted attached.
Here is the my actual trip data….
Return Weekend trip 1/2 12/10 highway. Augusta Maine to Bar Harbor, ME.
Model. AWD ER
Preconditioned? Yes
Ambient Temperature Start of Trip 34 F
Ambient Temperature End of Trip 55F
Continuous or broken (multi Leg) trip continuous
Climate mode Manual defrost and lower vents
Climate temp setpoint 65
# of Passengers 3
(I suggest we ignore seats and wheel settings)
Fan speed 1
Miles start 0
Miles End 0
Time Start 78.1
Time End 1hr 15m 48s
Average speed calc. 61.8MPH
Battery % Start. 79%
Battery % End. 42%
Vehicle Display Mi/kWh reset before trip? Y
Vehicle Display Mi/kWh after trip 2.6
CALC’d mi/kWh. 2.39. 8% error.
Fair weather, Rain, Snow Wet Roads Fog
Weekend trip 2/2 12/10/21 rural route, non highway.
Model. AWD ER
Preconditioned? Yes
Ambient Temperature Start of Trip 55F
Ambient Temperature End of Trip 56F
Continuous or broken (multi Leg) trip continuous
Climate mode Manual defrost and lower vents
Climate temp setpoint 65F
# of Passengers 3
(I suggest we ignore seats and wheel settings)
Fan speed 1
Miles start 0
Miles End 35.6
Time Start 0
Time End 43 Min 3 Sec
Average speed calc. 50 MPH
Battery % Start. 42%
Battery % End. 27%
Vehicle Display Mi/kWh reset before trip? Y
Vehicle Display Mi/kWh after trip 3.0
CALC’d mi/kWh. 2.70 10.1 % error
Fair weather, Rain, Snow wet roads fog
Overall trip 114.2 Miles 57.1 MPH 2.50 calc’d efficiency , 2.7 mi/kWh Display Efficiency. 7%-9% Error.


So interesting results from a recent 114.2 Mile trip looking at the meter data for an ER AWD in winter. It was a mild trip for 1/2 and wintery the other half. I was crowdsourcing data.
After returning home The car took exactly 46.76 KWh to recharge from this trip back to the original starting percentage. This is the gross reported out of my ChargePoint charger (from the charger software) to the Mach E. That corresponds and matches nearly exactly to the battery percentage used for this trip 79% to 27% which is very close to 52% of an 88 KW (.52x88, Battery size) or 45.76 kWh. (So strange this came out this way a 2% or 1 kW difference). This calculates to 2.5 Mi/KWh for the trip. So only 1 kW for internal charger losses, or 2% ?
Even if I take the % as the worst case (26.5% to 79.5%), that's 46.64 kWh or the best case (27.5%-78.5%) that's 44.88 kWh. so the difference from Charged to that usage is a range of difference of 0.24% to 4.01%
The strange thing is My EV data on FordPass shows I actually used 41.6 KWh for this trip (or 47% of the battery). If I divide the miles driven (114.2), I get the 2.7 mi/kWh reported by the car. It also notes a "driving efficiency" of 89%.
If I assume 9% for internal charger losses (What I saw on my Select for 11,000 miles and verified), that actually equals 45.7 kWh. (41.6/.91). These calcs are too close to perfect. But………
With this data working out like it is, I would have to assume the % battery display in the Mach E includes and added 9% factor for charger losses and our Mi/KWh on the display takes that factor of 9% away.
Or there are much lower charger losses in the Mach E than assumed and what came out of my ChargePoint made its way nearly lossless into the battery. We know that is not correct.
Or the battery percentage display is off by 9% (but FP reported 52% recharged to the battery last night.) I forgot to look at the charging data before we used the car today, so that is lost).
OR I guess the metering in my Chargepoint could be wrong.
Sorry, it was a boring Sunday night until Yellowstone was on, so I had some time to crunch these numbers. Sometimes being an engineer can be a burden.......
A FB Mach E Nation member Nick A found similar results on a long trip with his Select noted attached.
Here is the my actual trip data….
Return Weekend trip 1/2 12/10 highway. Augusta Maine to Bar Harbor, ME.
Model. AWD ER
Preconditioned? Yes
Ambient Temperature Start of Trip 34 F
Ambient Temperature End of Trip 55F
Continuous or broken (multi Leg) trip continuous
Climate mode Manual defrost and lower vents
Climate temp setpoint 65
# of Passengers 3
(I suggest we ignore seats and wheel settings)
Fan speed 1
Miles start 0
Miles End 0
Time Start 78.1
Time End 1hr 15m 48s
Average speed calc. 61.8MPH
Battery % Start. 79%
Battery % End. 42%
Vehicle Display Mi/kWh reset before trip? Y
Vehicle Display Mi/kWh after trip 2.6
CALC’d mi/kWh. 2.39. 8% error.
Fair weather, Rain, Snow Wet Roads Fog
Weekend trip 2/2 12/10/21 rural route, non highway.
Model. AWD ER
Preconditioned? Yes
Ambient Temperature Start of Trip 55F
Ambient Temperature End of Trip 56F
Continuous or broken (multi Leg) trip continuous
Climate mode Manual defrost and lower vents
Climate temp setpoint 65F
# of Passengers 3
(I suggest we ignore seats and wheel settings)
Fan speed 1
Miles start 0
Miles End 35.6
Time Start 0
Time End 43 Min 3 Sec
Average speed calc. 50 MPH
Battery % Start. 42%
Battery % End. 27%
Vehicle Display Mi/kWh reset before trip? Y
Vehicle Display Mi/kWh after trip 3.0
CALC’d mi/kWh. 2.70 10.1 % error
Fair weather, Rain, Snow wet roads fog
Overall trip 114.2 Miles 57.1 MPH 2.50 calc’d efficiency , 2.7 mi/kWh Display Efficiency. 7%-9% Error.
Sponsored
Last edited: