Call for crowd sourced battery efficiency data

Budman

Member
First Name
Rick
Joined
Dec 9, 2021
Threads
3
Messages
23
Reaction score
84
Location
Minneapolis, MN
Vehicles
Mach e Select RWD
Occupation
Engineer
Country flag
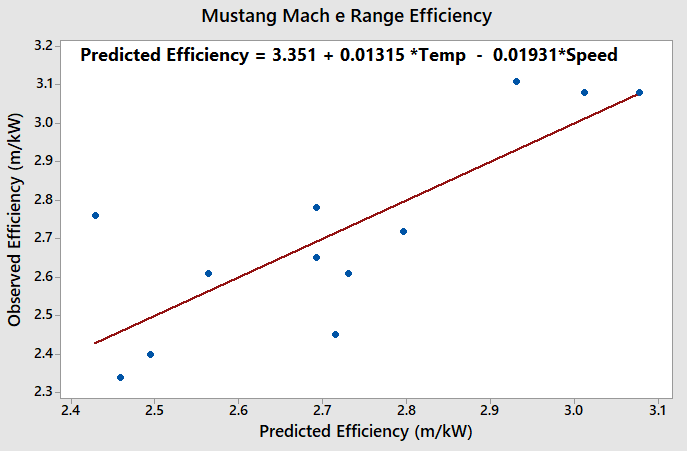
A recent post of a road trip report included a log of their observed efficiency (miles/kW) with the average temperature and average speeds seen during a stint of travel. I put their data into a multiple linear regression analysis to come up with an equation that will give a Predicted Battery Efficiency (miles/kW) vs Temperature and Speed as shown in the chart pasted below. This is only one small data set. A better model can be generated with more data. If others have data like this they can share I can add that to the database and update the results. This will give us all a better idea of the impacts of temperature and speed on range. From this initial data set for every 1 Deg F increase in temperature the efficiency goes up by 0.01315 miles/kW. For every 1 mph increase in speed the efficiency goes down by 0.01931 miles/kW.

Send me your data please!

Ford Mustang Mach-E Call for crowd sourced battery efficiency data 1639069641242
Sponsored


RickMachE

Well-Known Member
Joined
Jul 1, 2021
Threads
267
Messages
17,898
Reaction score
27,849
Location
SE MI
Vehicles
2022 Mach-E Premium 4X, 2022 Lightning Lariat ER
Country flag
I think the end result won't be useful, because there are a whole bunch of factors you're not including:

- Weight -4 passengers and luggage vs. 1 driver
- Altitude
- Wind
- Rain

Etc.
 
OP
OP

Budman

Member
First Name
Rick
Joined
Dec 9, 2021
Threads
3
Messages
23
Reaction score
84
Location
Minneapolis, MN
Vehicles
Mach e Select RWD
Occupation
Engineer
Country flag
I think the end result won't be useful, because there are a whole bunch of factors you're not including:

- Weight -4 passengers and luggage vs. 1 driver
- Altitude
- Wind
- Rain

Etc.

We can never capture all the variables but temperature and speed are by far the 2 largest. I personally will find it useful.
 
  • Like
Reactions: OWG

Nklem

Well-Known Member
First Name
Norm
Joined
May 20, 2021
Threads
105
Messages
1,318
Reaction score
1,699
Location
Coast of Maine
Vehicles
Subaru Solterra
Occupation
Mechanical Engineer
Country flag
I would be specific what you (or we) want, in a form. Just brainstorming some quick ideas:

Model
Preconditioned?
Ambient Temperature Start of Trip
Ambient Temperature End of Trip
Continuous or broken (multi Leg) trip
Climate mode
Climate temp setpoint
# of Passengers
(I suggest we ignore seats and wheel settings)
Fan speed
Miles start
Miles End
Time Start
Time End
Battery % Start
Battery % End
Vehicle Display Mi/kWh reset before trip?
Vehicle Display Mi/kWh after trip
Fair weather, Rain, Snow
Photos recommended

So many more I am sure....

I found the Mi/kWh reading was off by 12.5% on a recent trip. I do not know if we want that number except to show error. This AM, in snow, 18F for 11 miles, it was exactly spot on., 2.4 Displayed and calc' to 2.47. The 113.4 mile trip had the error. Also over the last two days, my battery percentage has gone up 2% on my commute home.....
 
Last edited:

Nklem

Well-Known Member
First Name
Norm
Joined
May 20, 2021
Threads
105
Messages
1,318
Reaction score
1,699
Location
Coast of Maine
Vehicles
Subaru Solterra
Occupation
Mechanical Engineer
Country flag
I would be specific what you (or we) want, in a form. Just brainstorming some quick ideas:
Today’s commute 12/10/21

Model. AWD ER
Preconditioned? Yes
Ambient Temperature Start of Trip 14F
Ambient Temperature End of Trip 13F
Continuous or broken (multi Leg) trip continuous
Climate mode auto-2
Climate temp setpoint 72
# of Passengers 1
(I suggest we ignore seats and wheel settings)
Fan speed auto
Miles start 0
Miles End 10.8
Time Start 0
Time End 17M 51S
Average speed calc. 36.3 MPG
Battery % Start. 66%
Battery % End. 60%
Vehicle Display Mi/kWh reset before trip? Y
Vehicle Display Mi/kWh after trip 2.1
CALC’d mi/kWh. 2.05
Fair weather, Rain, Snow Fair

Ford Mustang Mach-E Call for crowd sourced battery efficiency data 958F6F53-A1CE-4C6C-995F-A39CD21E5681


Ford Mustang Mach-E Call for crowd sourced battery efficiency data 5CB82DBF-A536-4DB1-898E-04C6C92B6428


Nklem

Well-Known Member
First Name
Norm
Joined
May 20, 2021
Threads
105
Messages
1,318
Reaction score
1,699
Location
Coast of Maine
Vehicles
Subaru Solterra
Occupation
Mechanical Engineer
Country flag
Yesterday’s commute 12/9/21

Model. AWD ER
Preconditioned? Yes
Ambient Temperature Start of Trip 24F
Ambient Temperature End of Trip 17F
Continuous or broken (multi Leg) trip continuous
Climate mode Manual defrost and lower vents
Climate temp setpoint 68
# of Passengers 1
(I suggest we ignore seats and wheel settings)
Fan speed 2
Miles start 0
Miles End 10.9
Time Start 0
Time End 20M 36S
Average speed calc. 31.5MPH
Battery % Start. 77%
Battery % End. 72%
Vehicle Display Mi/kWh reset before trip? Y
Vehicle Display Mi/kWh after trip 2.4
CALC’d mi/kWh. 2.47
Fair weather, Rain, Snow SNOW

Ford Mustang Mach-E Call for crowd sourced battery efficiency data 382BE080-E7FA-4896-8071-CC4257771DB4


Ford Mustang Mach-E Call for crowd sourced battery efficiency data 5D424B0B-45C0-4E7F-B8C1-B9A7A71C590E
 

Nklem

Well-Known Member
First Name
Norm
Joined
May 20, 2021
Threads
105
Messages
1,318
Reaction score
1,699
Location
Coast of Maine
Vehicles
Subaru Solterra
Occupation
Mechanical Engineer
Country flag
Weekend trip 1/2 12/10

Model. AWD ER
Preconditioned? No
Ambient Temperature Start of Trip 52 F
Ambient Temperature End of Trip 37F
Continuous or broken (multi Leg) trip continuous
Climate mode Manual defrost and lower vents
Climate temp setpoint 70
# of Passengers 3
(I suggest we ignore seats and wheel settings)
Fan speed 1
Miles start 0
Miles End 35.8
Time Start 0
Time End 49M 45S
Average speed calc. 43.2MPH
Battery % Start. 94%
Battery % End. 78%
Vehicle Display Mi/kWh reset before trip? Y
Vehicle Display Mi/kWh after trip 2.8
CALC’d mi/kWh. 2.54. 9.3% error.
Fair weather, Rain, Snow RAIN

Weekend trip 2/2 12/10/21 highway

Model. AWD ER
Preconditioned? Yes
Ambient Temperature Start of Trip 37F
Ambient Temperature End of Trip 33F
Continuous or broken (multi Leg) trip continuous
Climate mode Manual defrost and lower vents
Climate temp setpoint 70
# of Passengers 3
(I suggest we ignore seats and wheel settings)
Fan speed 1
Miles start 0
Miles End 78.7
Time Start 0
Time End 1:13:22
Average speed calc. 64.36MPH
Battery % Start. 78%
Battery % End. 37%
Vehicle Display Mi/kWh reset before trip? Y
Vehicle Display Mi/kWh after trip 2.4
CALC’d mi/kWh. 2.18 9.2% error
Fair weather, Rain, Snow Rain Fog


Overall trip 114.8 Miles 2.28 calc’d, 2.5 mi/kWh Display. 8.8% Error.
 
Last edited:

Nklem

Well-Known Member
First Name
Norm
Joined
May 20, 2021
Threads
105
Messages
1,318
Reaction score
1,699
Location
Coast of Maine
Vehicles
Subaru Solterra
Occupation
Mechanical Engineer
Country flag
Return Weekend trip 1/2 12/10

Model. AWD ER
Preconditioned? Yes
Ambient Temperature Start of Trip 34 F
Ambient Temperature End of Trip 55F
Continuous or broken (multi Leg) trip continuous
Climate mode Manual defrost and lower vents
Climate temp setpoint 65
# of Passengers 3
(I suggest we ignore seats and wheel settings)
Fan speed 1
Miles start 0
Miles End 0
Time Start 78.1
Time End 1hr 15m 48s
Average speed calc. 61.8MPH
Battery % Start. 79%
Battery % End. 42%
Vehicle Display Mi/kWh reset before trip? Y
Vehicle Display Mi/kWh after trip 2.6
CALC’d mi/kWh. 2.39. 8% error.
Fair weather, Rain, Snow Wet Roads Fog

Weekend trip 2/2 12/10/21 rural route

Model. AWD ER
Preconditioned? Yes
Ambient Temperature Start of Trip 55F
Ambient Temperature End of Trip 56F
Continuous or broken (multi Leg) trip continuous
Climate mode Manual defrost and lower vents
Climate temp setpoint 65F
# of Passengers 3
(I suggest we ignore seats and wheel settings)
Fan speed 1
Miles start 0
Miles End 35.6
Time Start 0
Time End 43 Min 3 Sec
Average speed calc. 50 MPH
Battery % Start. 42%
Battery % End. 27%
Vehicle Display Mi/kWh reset before trip? Y
Vehicle Display Mi/kWh after trip 3.0
CALC’d mi/kWh. 2.70 10.1 % error
Fair weather, Rain, Snow wet roads fog


Overall trip 114.2 Miles 57.1 MPH 2.50 calc’d, 2.7 mi/kWh Display. 7.4% Error.


Top