Rex
Well-Known Member
- First Name
- Rex
- Joined
- Aug 16, 2021
- Threads
- 22
- Messages
- 140
- Reaction score
- 64
- Location
- Dorset
- Vehicles
- Mach-E Premium AWD 2024
- Occupation
- retired
- Thread starter
- #1
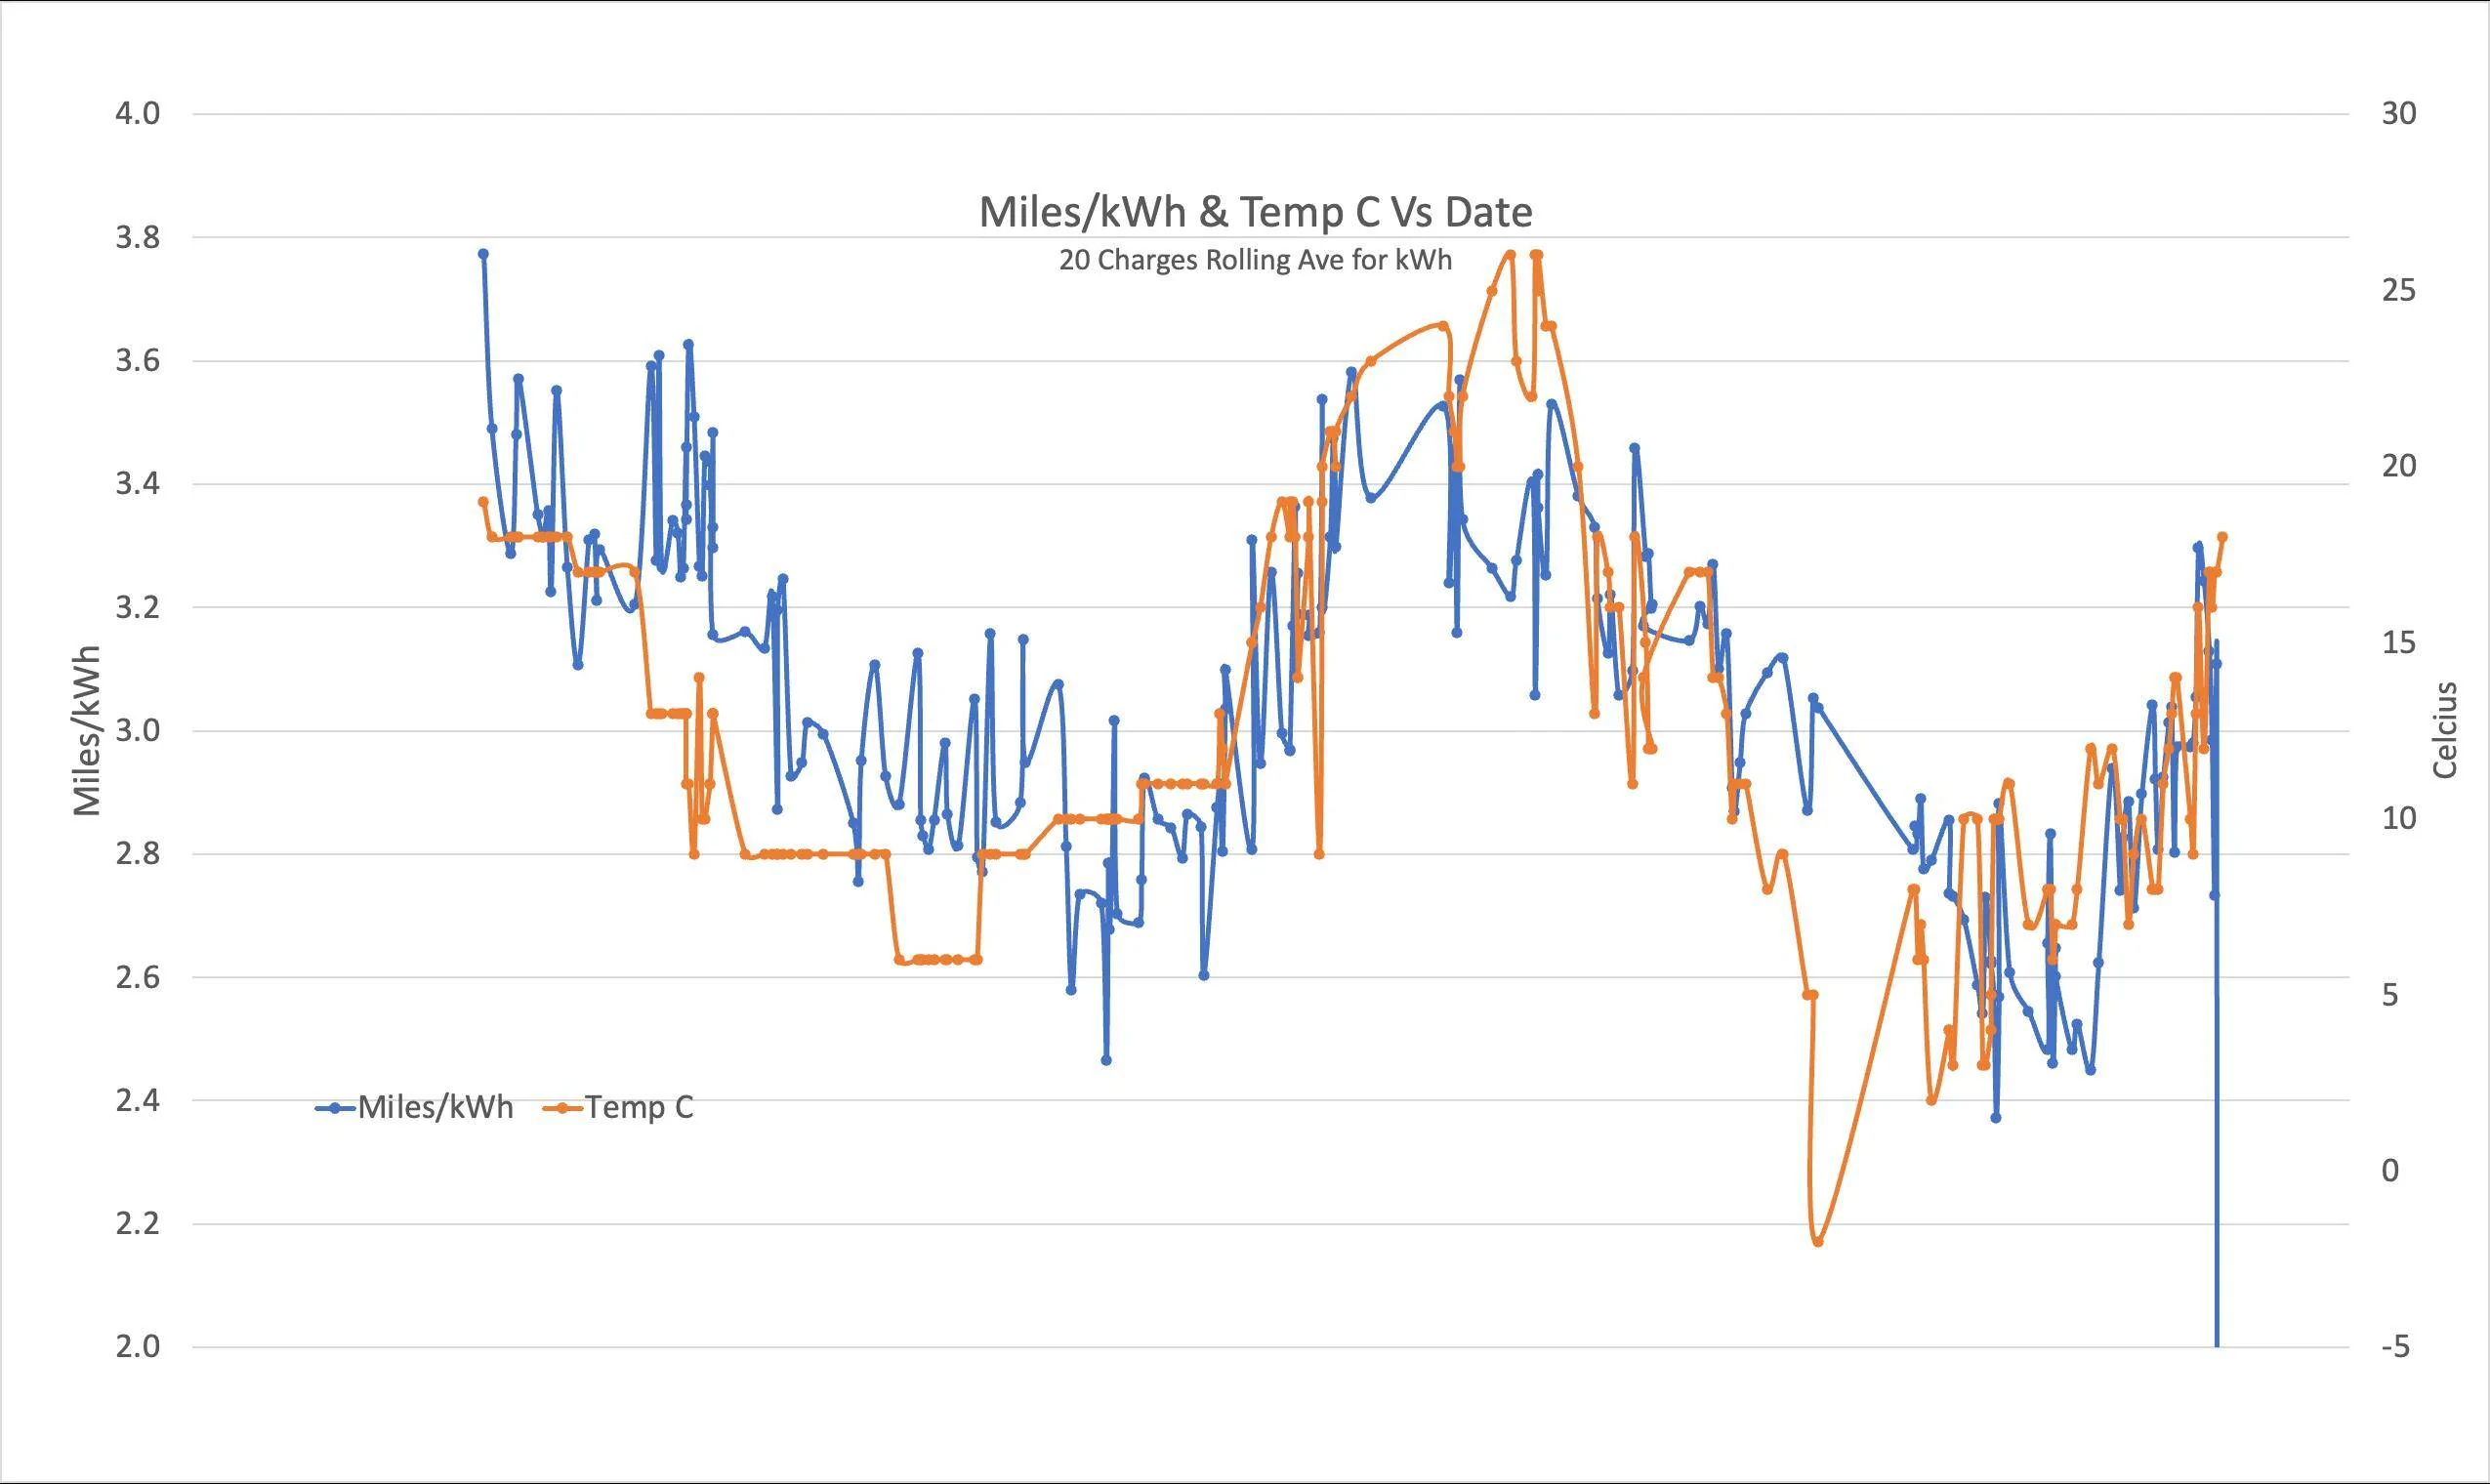
The X axis is 22 months but I've had a glass of wine and cannot get Excel to show the dates
")
The Miles/kWh is a rolling average of the previous 20 charges and the temp is the average around the time of charging.
Most of my driving is where I know I can charge at my destination and the journey is within the range of the MME (not necessarily within my need for a comfort stop!) so I enjoy the performance and don't try to maximise range.
I have plotted other graphs of range vs temp but this seemed to give the closest correlation.
Sponsored