ABRP Sample Roadtrip Comparison Across EV's

TheLight75

Well-Known Member
First Name
Rob
Joined
Oct 6, 2020
Threads
8
Messages
135
Reaction score
220
Location
Massachusetts
Vehicles
2018 VW Tiguan SEL
Occupation
IT
Country flag
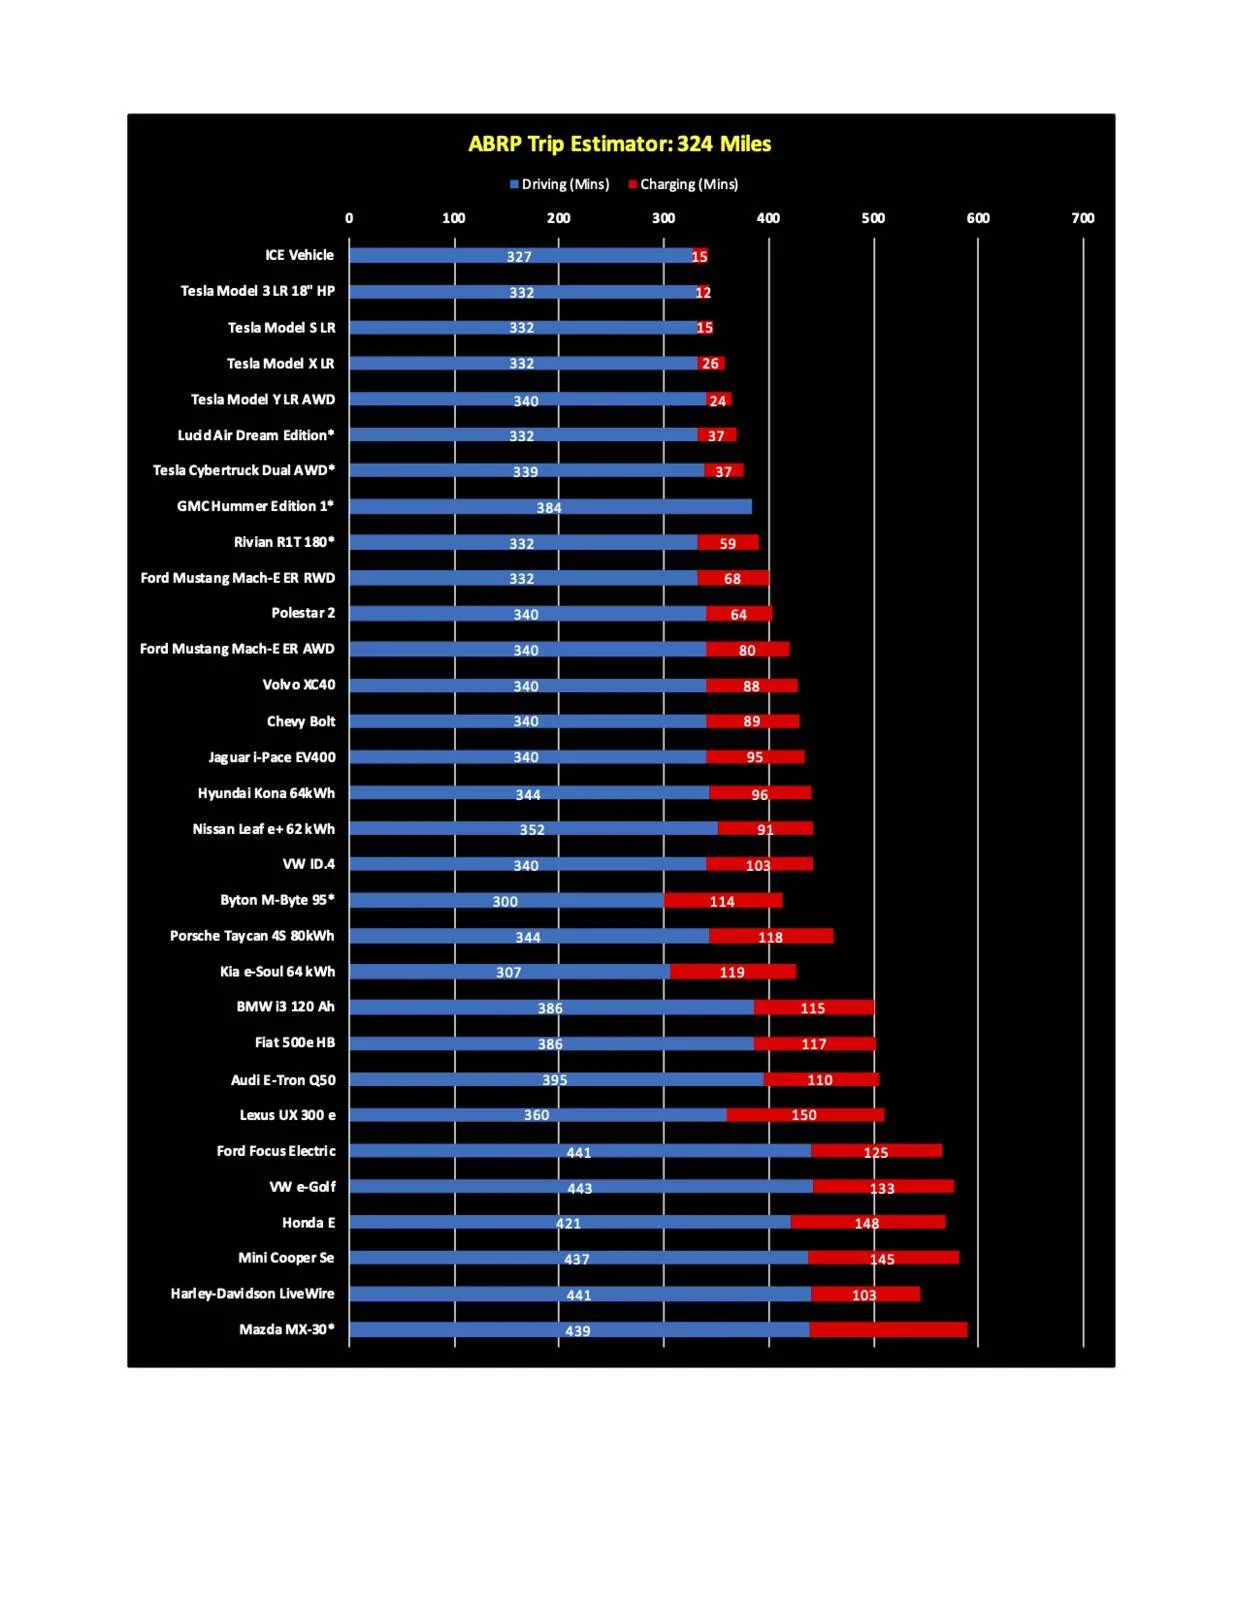
I put together a chart showing the ABRP (abetterrouteplanner.com) results for a 324 mile EV road trip I took last December across 29 different EV's. The trip starts in Marlborough, MA and ends in Montreal, QC at a constant outside temp of 40F and goes through both flat plains and mountains. The chargers along the way include EVgo 50 kW but no EA DCFC's as they aren't in operation yet. I also included a standard "ICE Vehicle" for the same trip using Google Maps (assuming one 15 minute gas/snack/bio break stop). Vehicles with asterisks are not yet available.

Not surprisingly, Tesla dominated the top end of the results. I was surprised to see the Mach-E stuck between the Polestar 2 (EPA: 233 miles) and the Volvo XC40 (EPA: 208 miles). Perhaps this is due to the sheer weight of Mach-E?
Ford Mustang Mach-E ABRP Sample Roadtrip Comparison Across EV's EV Road Trip Estimate
Sponsored

 
Last edited:

timbop

Well-Known Member
First Name
Tim
Joined
Jan 3, 2020
Threads
63
Messages
6,729
Reaction score
13,758
Location
New Jersey
Vehicles
Solar powered 2021 MME ER RWD & 2022 Corsair PHEV
Occupation
Software Engineer
Country flag
I was surprised to see the Mach-E stuck between the Polestar 2 (EPA: 233 miles) and the Volvo XC40 (EPA: 208 miles). Perhaps this is due to the sheer weight of Mach-E?
It's all related to charging speed. You've got 50kw chargers in there which charge them all at the same rate so the Bolt is in the same band as cars that CAN charge more than twice as fast. You are thus handicapping ALL of the CCS cars relative to the Tesla superchargers.

Pick a trip that actually has 150kw EA chargers and you'll see a marked improvement.
 

sockmeister

Well-Known Member
Joined
Sep 24, 2020
Threads
6
Messages
1,879
Reaction score
2,992
Location
Pennsylvania
Vehicles
2021 Mustang Mach-E4x
Occupation
SW Engineer
Country flag
Great comparison. Thanks!

I think it's also not taking into account, as you mentioned, any DCFCs along the way.
If it did, I'd expect the charging time to shorten dramatically.
Tesla can take advantage of the superchargers.

Also, this is based on pre-EPA numbers probably, and it's the AWD version. How did the RWD Mach-e do?
 
OP
OP
TheLight75

TheLight75

Well-Known Member
First Name
Rob
Joined
Oct 6, 2020
Threads
8
Messages
135
Reaction score
220
Location
Massachusetts
Vehicles
2018 VW Tiguan SEL
Occupation
IT
Country flag
It's all related to charging speed. You've got 50kw chargers in there which charge them all at the same rate so the Bolt is in the same band as cars that CAN charge more than twice as fast. You are thus handicapping ALL of the CCS cars relative to the Tesla superchargers.

Pick a trip that actually has 150kw EA chargers and you'll see a marked improvement.
I agree, but the point of the comparison was to show a real-world trip that doesn't have ideal charging available.
 

sockmeister

Well-Known Member
Joined
Sep 24, 2020
Threads
6
Messages
1,879
Reaction score
2,992
Location
Pennsylvania
Vehicles
2021 Mustang Mach-E4x
Occupation
SW Engineer
Country flag
I agree, but the point of the comparison was to show a real-world trip that doesn't have ideal charging available.
But then a fair comparison is to exclude tesla superchargers too.

In a non-ideal scenario without fast charging, yeah, it's going to be tough and it's gonna take time. 1h 20 minutes charging isn't so bad for 5hr+ driving. With no DCFC, that is.


OP
OP
TheLight75

TheLight75

Well-Known Member
First Name
Rob
Joined
Oct 6, 2020
Threads
8
Messages
135
Reaction score
220
Location
Massachusetts
Vehicles
2018 VW Tiguan SEL
Occupation
IT
Country flag
Also, this is based on pre-EPA numbers probably, and it's the AWD version. How did the RWD Mach-e do?
I updated the chart to include the ER RWD MME. It shaved 20 mins off the trip compared to the ER AWD MME.
 

timbop

Well-Known Member
First Name
Tim
Joined
Jan 3, 2020
Threads
63
Messages
6,729
Reaction score
13,758
Location
New Jersey
Vehicles
Solar powered 2021 MME ER RWD & 2022 Corsair PHEV
Occupation
Software Engineer
Country flag
I agree, but the point of the comparison was to show a real-world trip that doesn't have ideal charging available.
For a true comparison between EV's you should also map a trip from say Philadelphia to Atlanta where there are CCS chargers comparable to Superchargers, and thus the difference among CCS cars will be more pronounced as well as more competitive with Tesla.
 

EVer

Well-Known Member
Joined
Apr 21, 2020
Threads
0
Messages
455
Reaction score
455
Location
San Diego, CA
Vehicles
Ford F-150 SuperCrew Cab, Tesla Model 3P
Country flag
Does abetterrouteplanner document its methodology? The average speeds, I presume, are intended to balance energy consumption with total time (moving + charging), but where are they pulling efficiencies from to for example say the hummer, which has only a target range, can make it in a single charge at 51MPH, but not say 53MPH? If the chart said 403 minutes for the hummer I could at least conclude they're using the average highway speed of the EPA test cycle, but they didn't.

Perhaps they're applying some penalty factor to speeds above EPA range. GM's claim is 350 miles EPA (i.e., at 48MPH), and here they have it going 26 fewer miles but 3MPH faster).
 
Last edited:

timbop

Well-Known Member
First Name
Tim
Joined
Jan 3, 2020
Threads
63
Messages
6,729
Reaction score
13,758
Location
New Jersey
Vehicles
Solar powered 2021 MME ER RWD & 2022 Corsair PHEV
Occupation
Software Engineer
Country flag
Using ABRP to go 550 miles (~9hr drive time) from my home in NJ to Charlotte NC with speed capped at 107% of posted limit , 15% minimum arrival SOC and max charging at 80%, I get the following charge times (no sexy graphs):

Tesla MY LR AWD: 41 min (7.6%)
Tesla M3 LR AWD: 51 min (9.4%)
Tesla M3 SR+ (2020): 1:10 (13%)
MME ER RWD: 1:17 (14%)
MME ER AWD: 1:31 (17%)
Hyundai Kona (2021): 1:45 (19%)
Audi Q4 etron: 1:49 (20%)
Chevy Bolt (2020): 2:15 (25%)
 
Last edited:

EVer

Well-Known Member
Joined
Apr 21, 2020
Threads
0
Messages
455
Reaction score
455
Location
San Diego, CA
Vehicles
Ford F-150 SuperCrew Cab, Tesla Model 3P
Country flag

timbop

Well-Known Member
First Name
Tim
Joined
Jan 3, 2020
Threads
63
Messages
6,729
Reaction score
13,758
Location
New Jersey
Vehicles
Solar powered 2021 MME ER RWD & 2022 Corsair PHEV
Occupation
Software Engineer
Country flag
Now I have more questions... :)

The M3 LR AWD is more efficient than the MY LR AWD; that trip in the former should be shorter than in the latter, but it's shown as taking 25% longer. Is ABRP using charging curves, and is the charging curve substantially different between M3 and MY?

https://www.fueleconomy.gov/feg/Find.do?action=sbs&id=43401&id=43406
ABRP absolutely takes into account the charging curve. I didn't write it, I'm only reporting on it :)
 

timbop

Well-Known Member
First Name
Tim
Joined
Jan 3, 2020
Threads
63
Messages
6,729
Reaction score
13,758
Location
New Jersey
Vehicles
Solar powered 2021 MME ER RWD & 2022 Corsair PHEV
Occupation
Software Engineer
Country flag
ABRP absolutely takes into account the charging curve. I didn't write it, I'm only reporting on it :)
Actually, I just noticed that it planned 3 stops for the M3 and 4 for the MY, but charging to a lower SOC for MY - so using more of the meat of the charging curve.
 

timbop

Well-Known Member
First Name
Tim
Joined
Jan 3, 2020
Threads
63
Messages
6,729
Reaction score
13,758
Location
New Jersey
Vehicles
Solar powered 2021 MME ER RWD & 2022 Corsair PHEV
Occupation
Software Engineer
Country flag
If I change the max SOC% to 60, the M3 and MY flip-flop. What I have also found is that you can tweak the charge levels at each stop to optimize that particular journey

M3 LR AWD: 48 Min, 4 stops
MY LR AWD: 55 min, 5 stops
MME ER RWD: 1:20, 5 stops
MME ER AWD: 1:30, 5 stops
Oh, the charging time also includes the time to get to the charger from the highway, so for the MY the 5th charger could be farther off the route
 

codeGR

Member
First Name
Nick
Joined
Oct 29, 2020
Threads
0
Messages
22
Reaction score
14
Location
Grand Rapids, MI
Vehicles
2018 Ford Edge Titanium, (on order) 2021 Ford Mustang Mach-E Premium AWD Standard Range
Country flag
Where does the standard range model fit in?
Sponsored


Top