- Joined
- Mar 9, 2021
- Threads
- 50
- Messages
- 1,393
- Reaction score
- 1,770
- Location
- People's Republic of California
- Vehicles
- Mach-E, et al
- Thread starter
- Banned
- #1
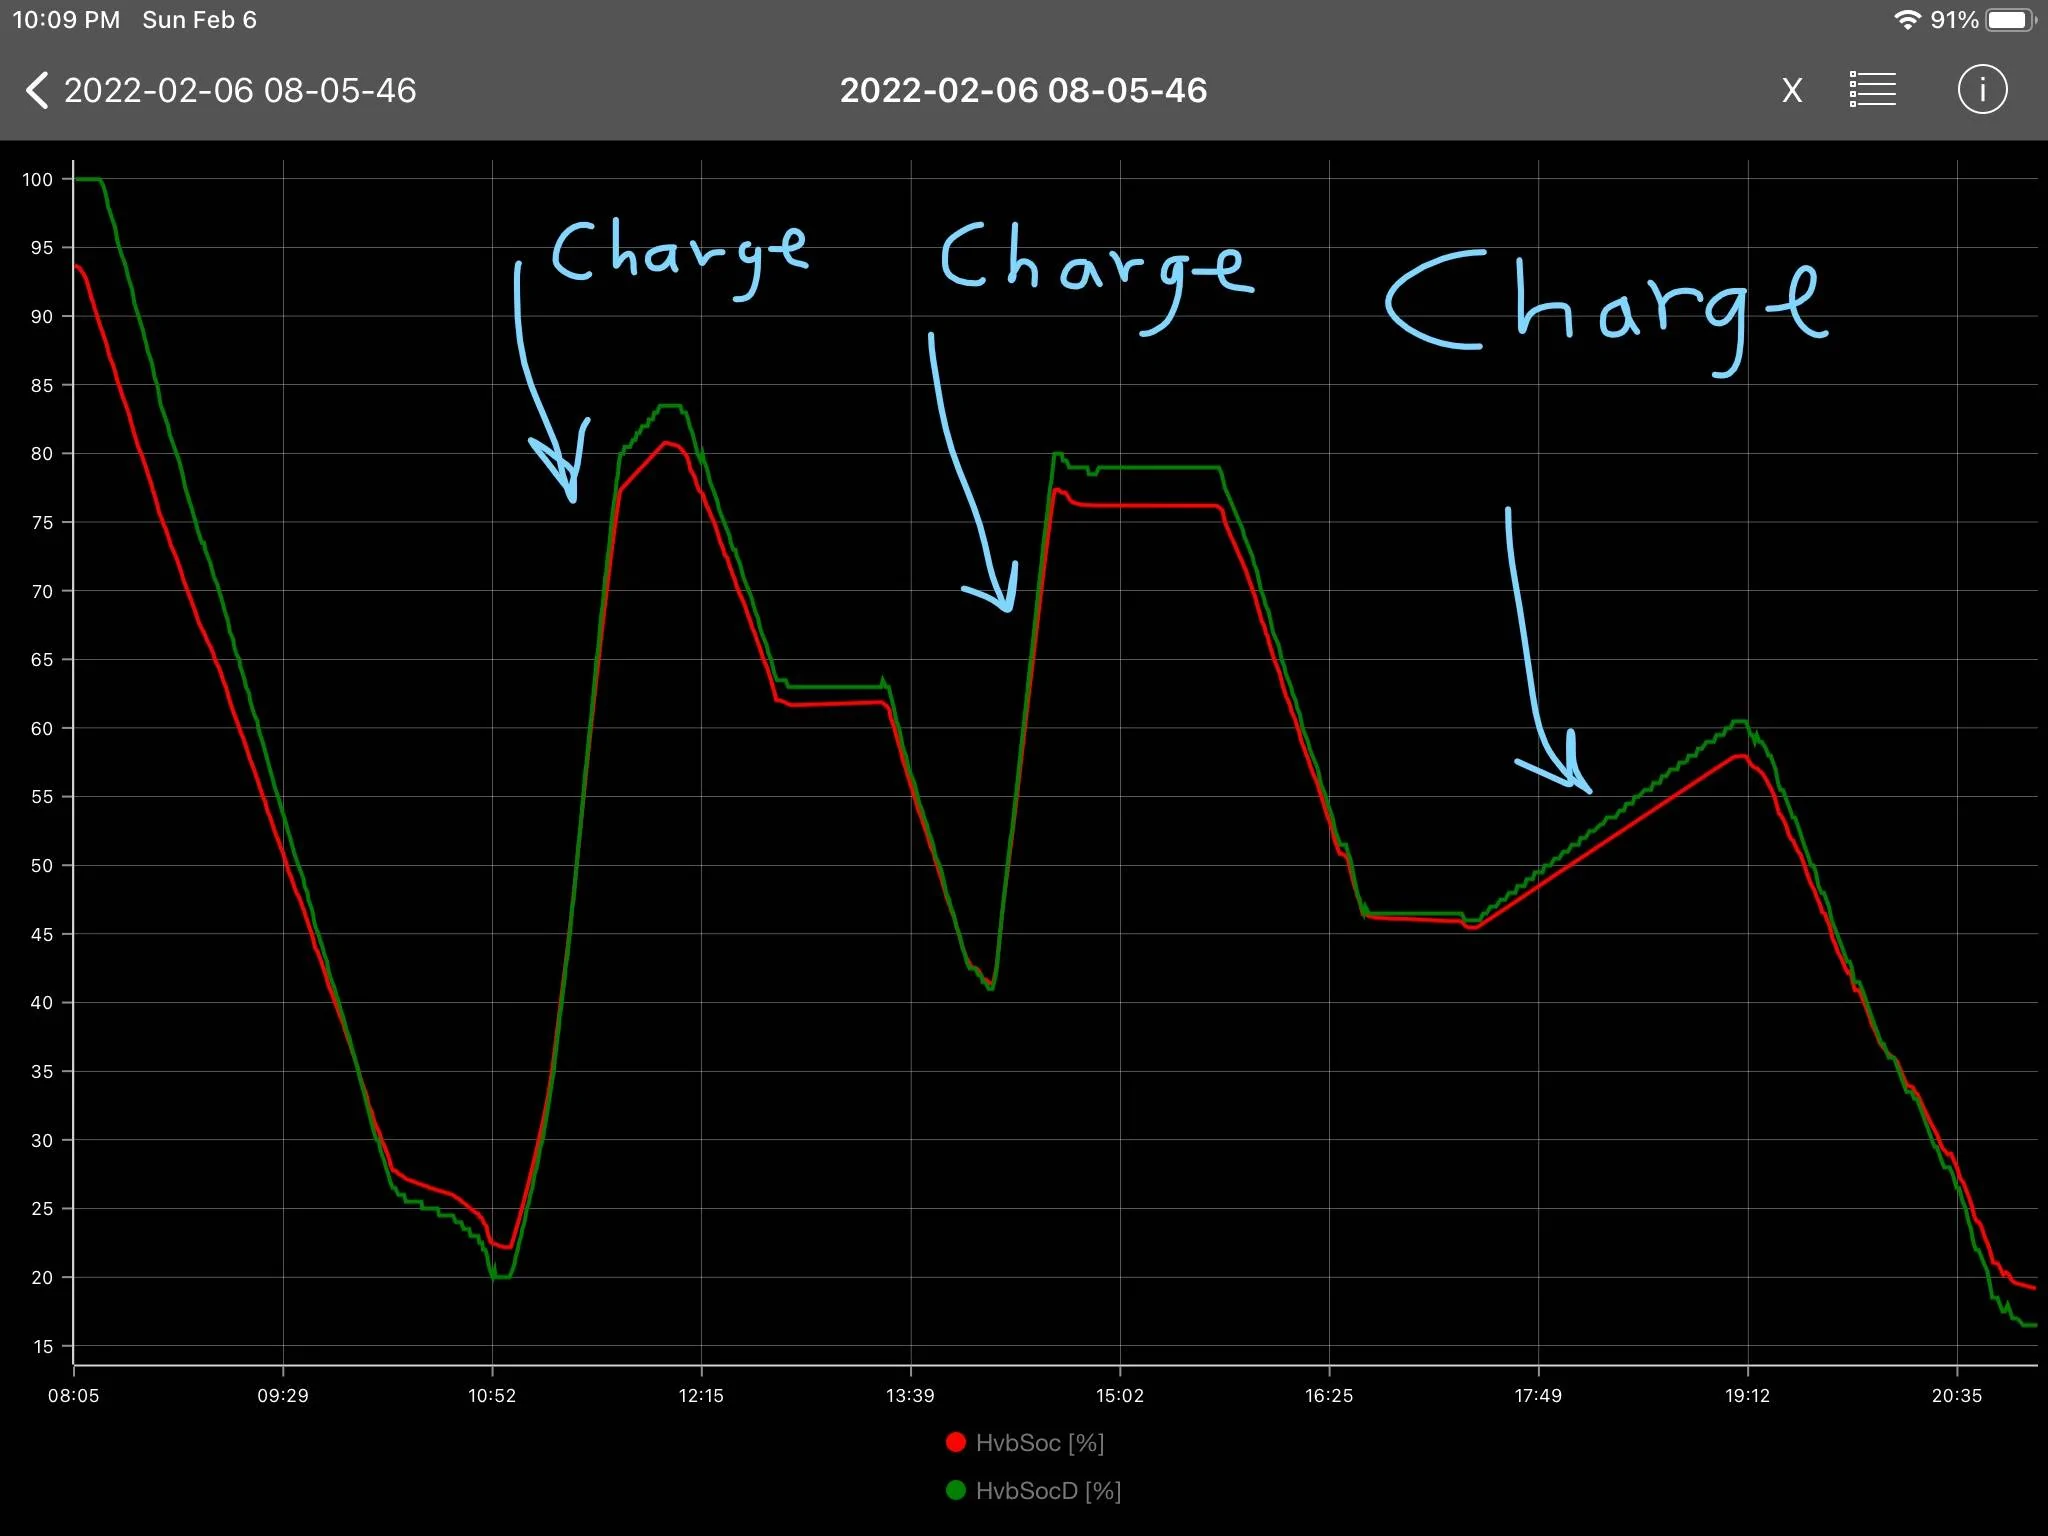
So I decided to make a 39.3 mile trip (60% city, 40% freeway) and calculate the efficiency numbers and compare it with what the car reported. The car was charged to 80% before and after the trip.
The meter reported 17.188 kWh.
FordPass reported 14.28 kWh (which means 20.4% was wasted)
GOM reported efficiency: 3.1 mi/kWh
Actual efficiency based on consumed power: 2.286 mi/kWh (which is 35.6% less)
Translating this into prices @ 43c/kWh
Real cost per mile: $.188
The last gas price I've seen was $6.49/gal, the equivalent gas efficiency is 34.6 mi/gal
Sponsored

")