Tyldum
Well-Known Member
- Joined
- Sep 25, 2020
- Threads
- 1
- Messages
- 361
- Reaction score
- 376
- Location
- Norway
- Vehicles
- Mustang Mach E First Edition
- Thread starter
- #1
Just thought I'd share my range stats.
This is a FE (AWD LR). Now I leave in northern Norway, so the number of days we hit >20C are close to nil.
I'm charging every night up to 90%, and most days I drive it down to 80% during my commute ("climate" and "outside temperature" are significant as a result).
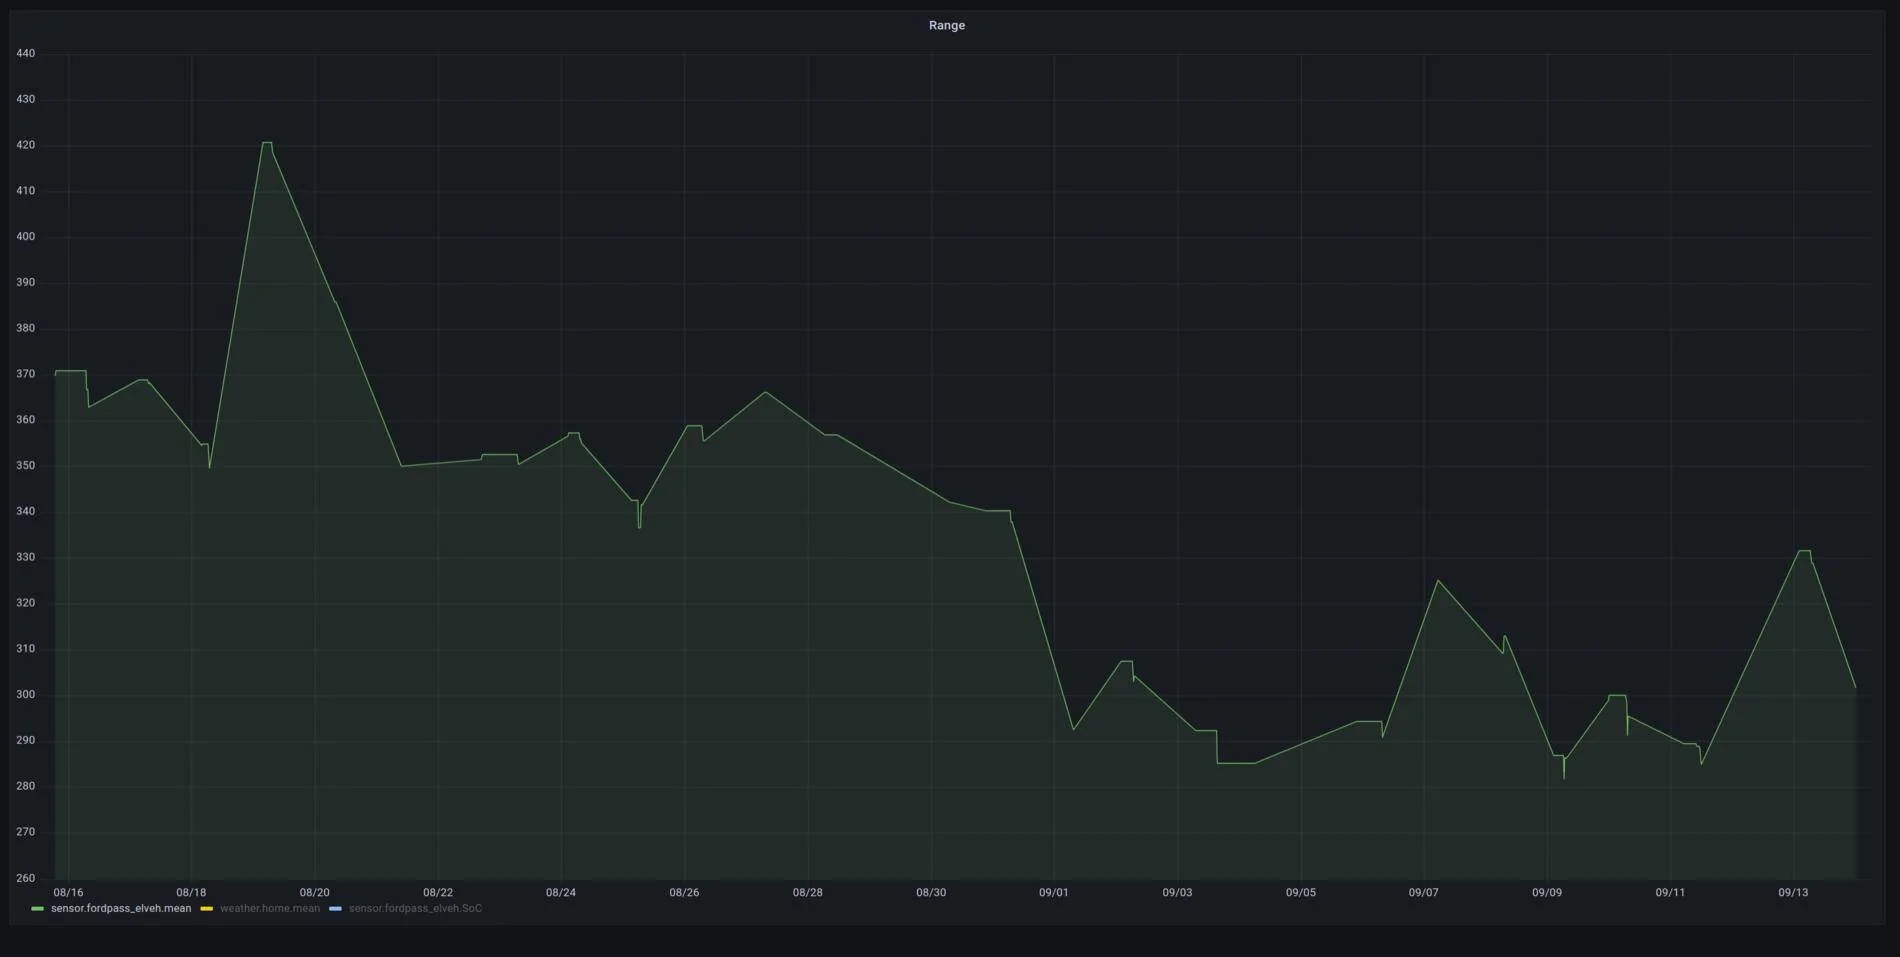
Now, I'm reading off the API the status of the car (SoC, alarm status, door status, etc) and recording it. So I thought I'd share a graph that shows the incredible variance of the GOM over the course of a month of pretty consistwnt usage of the car - basically just my commute and the weekly errands.
The graph is made up of the GOM range whenever the SoC has been equal to 90%. It varies from 420 km to 285km...
So what causes the GOM to vary so much? I really have no idea. I do also track outside temperature, but the correlation to the GOM range is very minor. I mean it's there, but only slighlty. Also, the temps have been very consistent during this period, no big fluctuations.
And before I get a brigade of "ignore the GOM", yes I largely do. This is not a post to complain about the range nor the GOM, just illustrating what the GOM shows for me at 90% SoC for a month.
Range is on the left scale, in kilometers.

This is a FE (AWD LR). Now I leave in northern Norway, so the number of days we hit >20C are close to nil.
I'm charging every night up to 90%, and most days I drive it down to 80% during my commute ("climate" and "outside temperature" are significant as a result).
Now, I'm reading off the API the status of the car (SoC, alarm status, door status, etc) and recording it. So I thought I'd share a graph that shows the incredible variance of the GOM over the course of a month of pretty consistwnt usage of the car - basically just my commute and the weekly errands.
The graph is made up of the GOM range whenever the SoC has been equal to 90%. It varies from 420 km to 285km...
So what causes the GOM to vary so much? I really have no idea. I do also track outside temperature, but the correlation to the GOM range is very minor. I mean it's there, but only slighlty. Also, the temps have been very consistent during this period, no big fluctuations.
And before I get a brigade of "ignore the GOM", yes I largely do. This is not a post to complain about the range nor the GOM, just illustrating what the GOM shows for me at 90% SoC for a month.
Range is on the left scale, in kilometers.
Sponsored