Submitted Orders Tracking List and Stats [Enter Yours]
- Thread starter Administrator
- Start date
- Watchers 342
mkhuffman
Well-Known Member
- First Name
- Mike
- Joined
- Nov 19, 2020
- Threads
- 29
- Messages
- 6,878
- Reaction score
- 9,512
- Location
- Virginia
- Vehicles
- 2025 Rivian R1T Tri-Max, Jeep GC-L, VW Jetta
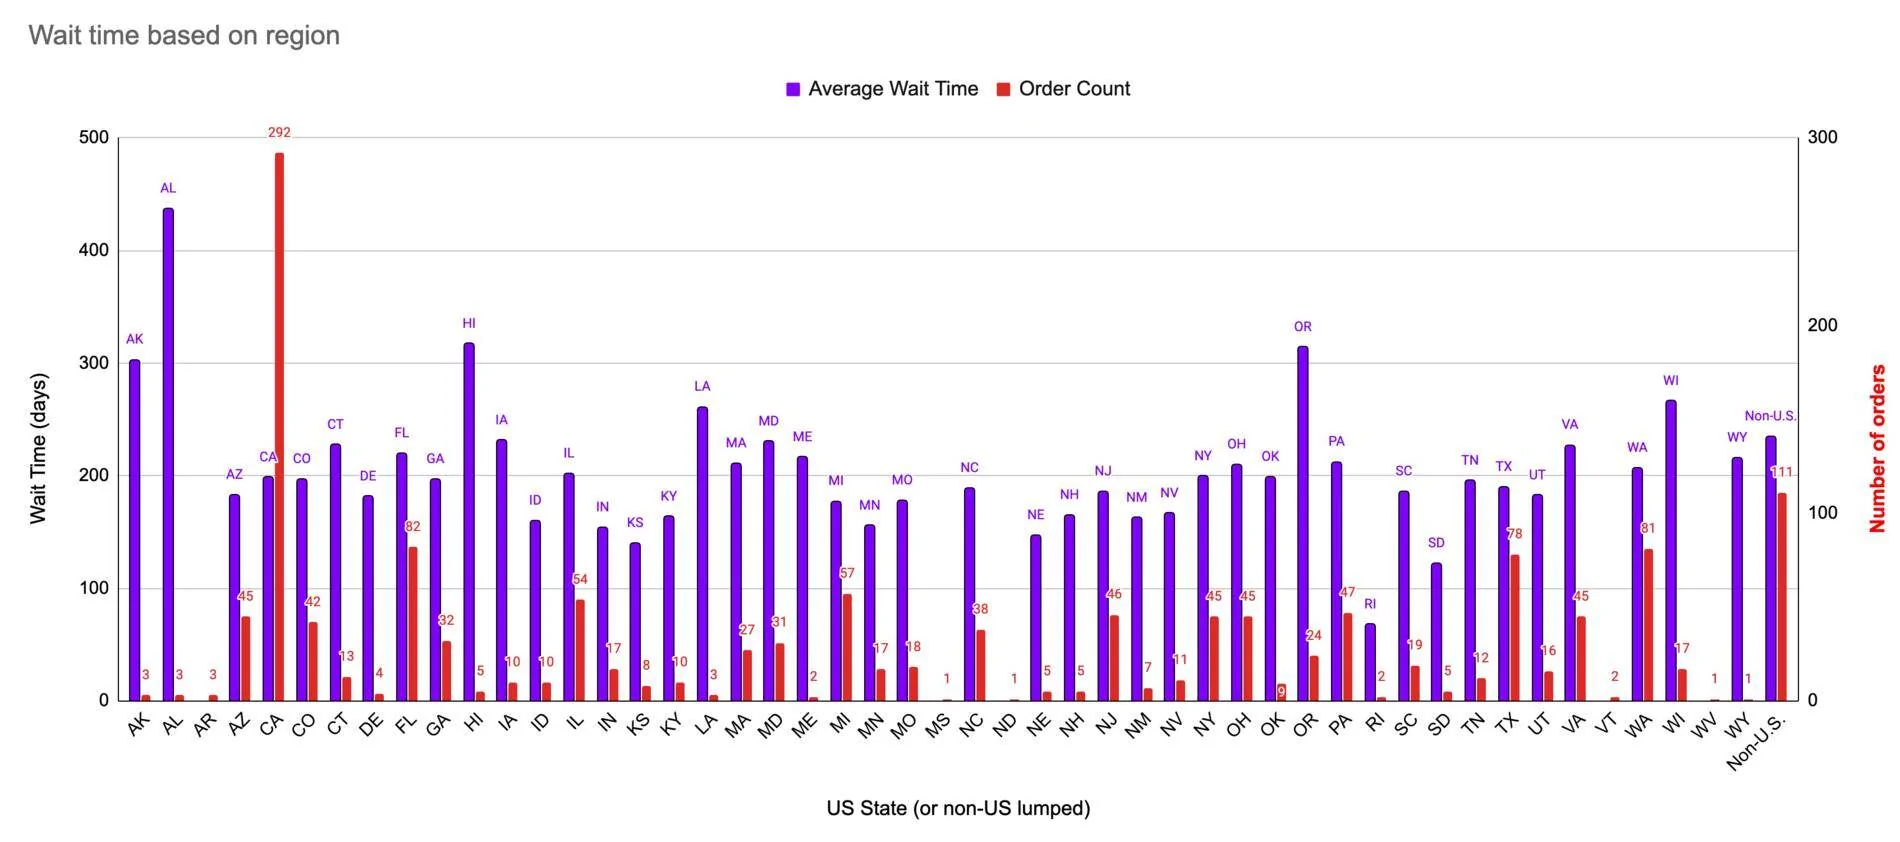
Very nice work! It would be very interesting to compare ZEV states to non ZEV states. I bet the ZEV states have better results.And, finally, wait time based on region. These are more dependent on outliers because in some states there are fewer orders than is strictly useful for statistical analysis. This also doesn't include a wait time for every count because not all respondents have answered the delivery date question yet while most have answered the location question.

SpaceEVDriver
Well-Known Member
- Joined
- Aug 26, 2021
- Threads
- 71
- Messages
- 2,654
- Reaction score
- 4,778
- Location
- Arizona
- Vehicles
- 2022 CA Route 1 AWD, ER; 2023 Lightning Lariat ER
- Occupation
- Planetary Science
Do you know of a list that identifies the ZEV states?Very nice work! It would be very interesting to compare ZEV states to non ZEV states. I bet the ZEV states have better results.
mkhuffman
Well-Known Member
- First Name
- Mike
- Joined
- Nov 19, 2020
- Threads
- 29
- Messages
- 6,878
- Reaction score
- 9,512
- Location
- Virginia
- Vehicles
- 2025 Rivian R1T Tri-Max, Jeep GC-L, VW Jetta
https://thegreencarguy.com/those-zev-states-explained/Do you know of a list that identifies the ZEV states?
SpaceEVDriver
Well-Known Member
- Joined
- Aug 26, 2021
- Threads
- 71
- Messages
- 2,654
- Reaction score
- 4,778
- Location
- Arizona
- Vehicles
- 2022 CA Route 1 AWD, ER; 2023 Lightning Lariat ER
- Occupation
- Planetary Science
To really dig into comparing averages, we have to be careful about how we count things. For example, the average wait time in this table is 204 days. However, that doesn't count anyone who hasn't received their vehicles yet. It also doesn't count anyone who has received their vehicle but didn't fill in that portion of the table. Meanwhile, the count shown in that plot is of all vehicles ordered.Very nice work! It would be very interesting to compare ZEV states to non ZEV states. I bet the ZEV states have better results.
Plotting those two slightly different metrics together is somewhat misleading. We have 1462 reported orders but only 410 reported deliveries. With no knowledge about which orders have been delivered but not reported, we have to be careful.
So, I took a ratio: [completed orders]/[total orders] for the ZEV states (~26%) vs the non-ZEV states (~30%) vs non-US (~39%).
But, again, this is funky because 1) we don't know who is out there enjoying their Mustang instead of coming back here to fill in delivery dates (so selfish! ?); 2) we know that at least some of the ZEV states had many more orders, and more orders over time, which could leave them with worse delivery ratios because those customers are still waiting; 3) we don't know how much influence dealers nor Ford-dealer relationships have on the order rate; 4) we start getting into having to account for small numbers and that really mucks with error bars (which I haven't reported yet). An example is Maine, which had two orders and two deliveries. That's a 100% delivery ratio, but it could drop to 20% delivery ratio tomorrow if a relatively small number of orders came in.
I'm not ready to post another plot because I'm not certain that I'm comfortable that I know the right way to represent the comparison data.
To be sure, each of the plots I've already posted have to be considered with these issues, but the ideas behind the plots are much more general and robust to these more subtle issues: there's probably not likely to be a substantially difference between GT and Premium purchasers and their response rate to the delivery date question in this thread.
Sorry for the wall of text. As a mathematician and scientist, I tend to geek out about mathematics.
BrianM
New Member
- First Name
- Brian
- Joined
- Sep 30, 2021
- Threads
- 0
- Messages
- 4
- Reaction score
- 0
- Location
- Richmond VA
- Vehicles
- Mach E GT
order submitted for tracking
Sleevesmcd
Member
- First Name
- Dan
- Joined
- Sep 30, 2021
- Threads
- 1
- Messages
- 18
- Reaction score
- 48
- Location
- East Windsor, NJ
- Vehicles
- Ford Mach-E Premium
Order submitted for tracking.
MachLee
Active Member
- Joined
- Jul 13, 2021
- Threads
- 0
- Messages
- 25
- Reaction score
- 33
- Location
- South Florida
- Vehicles
- 2021 Mustang Mach-E
Hi! We have added our order to the spreadsheet.Welcome to the Mach E Forum Submitted Orders List. And congrats to all the future owners on the list!
This list is for ACCEPTED ORDERS ONLY (reservations which have been converted to accepted orders).
1. Please use the Order Submission Form to add yourself to the list.
2. Post a reply in this thread to let us know.
3. Once your submission is approved it will show up in the list.
4. Be sure to check out the STATS sheet below for detailed infographics on take rates for model/trim, colors, drivetrain and battery.
5. Use the Change Request Form to request any changes to your order info in the tracker.
The more crowdsourced data we have, the more helpful it will be for everyone to track the progress of their orders as we move towards the first deliveries!
Ktnluksmom
Active Member
- First Name
- Stephanie
- Joined
- Oct 5, 2021
- Threads
- 0
- Messages
- 25
- Reaction score
- 71
- Location
- Wentzville, Missouri
- Vehicles
- 2020 Ford Escape hybrid, 2022 Mach-e prem ex rwd
I’ve added my order as well. Sooo excited.
Mach-Lee
Well-Known Member
- First Name
- Lee
- Joined
- Jul 16, 2021
- Threads
- 262
- Messages
- 11,366
- Reaction score
- 25,029
- Location
- Wisconsin
- Vehicles
- 2022 Mach-E Premium AWD
- Occupation
- Sci/Eng
You should maybe filter out states with a low sample size, like <5?And, finally, wait time based on region. These are more dependent on outliers because in some states there are fewer orders than is strictly useful for statistical analysis. This also doesn't include a wait time for every count because not all respondents have answered the delivery date question yet while most have answered the location question.
Great to know WI ranks right up there with wait times. OR might make sense because of the greater distance and mountains, but what's up with WI, AL, LA?
Here's my gripe topic, I appreciate the insight on the ZEV state comparisons but I understand holding back if there's not enough data to make a significant comparison: https://www.macheforum.com/site/threads/waiting-in-a-non-zev-state-sucks.9798/So, I took a ratio: [completed orders]/[total orders] for the ZEV states (~26%) vs the non-ZEV states (~30%) vs non-US (~39%).
But, again, this is funky because 1) we don't know who is out there enjoying their Mustang instead of coming back here to fill in delivery dates (so selfish! ?); 2) we know that at least some of the ZEV states had many more orders, and more orders over time, which could leave them with worse delivery ratios because those customers are still waiting; 3) we don't know how much influence dealers nor Ford-dealer relationships have on the order rate; 4) we start getting into having to account for small numbers and that really mucks with error bars (which I haven't reported yet). An example is Maine, which had two orders and two deliveries. That's a 100% delivery ratio, but it could drop to 20% delivery ratio tomorrow if a relatively small number of orders came in.
I'm not ready to post another plot because I'm not certain that I'm comfortable that I know the right way to represent the comparison data.
Just an idea, but perhaps we could get someone to message members when it's been more than 7-8 months from their order date asking for an update?
Did you try looking at wait time in ZEV states vs. non (aggregated data)? Anything there?
Humblest
Well-Known Member
- First Name
- Mike
- Joined
- Jul 15, 2021
- Threads
- 3
- Messages
- 133
- Reaction score
- 170
- Location
- California
- Vehicles
- '22 MME Premium AWD ER; '21 Mini SE (EV)
It's frustrating seeing newer orders than mine that are scheduled for production, so I dug a little deeper into the spreadsheet. Filtered for orders similar to mine (premium AWD ER in California) I find that the proportion showing scheduled production dates seems sort of consistent through May/June time frame then falls off. Unfiltered (i.e. all orders), the falloff seems to be about the same.
What does this mean? I can hope that my early June order will be scheduled soon.
Sorry, no requests. Although I exported to Excel, I did most of this manually. If I get around to doing it right then I can share more.
What does this mean? I can hope that my early June order will be scheduled soon.
Sorry, no requests. Although I exported to Excel, I did most of this manually. If I get around to doing it right then I can share more.
SpaceEVDriver
Well-Known Member
- Joined
- Aug 26, 2021
- Threads
- 71
- Messages
- 2,654
- Reaction score
- 4,778
- Location
- Arizona
- Vehicles
- 2022 CA Route 1 AWD, ER; 2023 Lightning Lariat ER
- Occupation
- Planetary Science
Those states you mentioned all have low order completion numbers, so it's difficult to make clear statements about what's going on.You should maybe filter out states with a low sample size, like <5?
Great to know WI ranks right up there with wait times. OR might make sense because of the greater distance and mountains, but what's up with WI, AL, LA?
...
Did you try looking at wait time in ZEV states vs. non (aggregated data)? Anything there?
Filtering is a reasonable approach. Doing so increases the overall (all region) average wait a bit (states with fewer reported order completions have a slightly lower than average wait time).
Filtering out anything with five or fewer reported order completions gives:
- The overall (US only) average wait time is 202 days (291 reported completed orders);
- ZEV state average wait time is 207 days (136 reported completed orders);
- Non-ZEV (US only) wait time is 199 days (155 reported completed orders);
- Non-US wait time is 235 days (43 reported completed orders).
SpaceEVDriver
Well-Known Member
- Joined
- Aug 26, 2021
- Threads
- 71
- Messages
- 2,654
- Reaction score
- 4,778
- Location
- Arizona
- Vehicles
- 2022 CA Route 1 AWD, ER; 2023 Lightning Lariat ER
- Occupation
- Planetary Science
The average wait for that specific combination is 199 days (with 17 reported deliveries). We're 133 days from 1 June. I haven't looked at build dates, just delivery dates, and I haven't looked at order dates close to yours (that would likely reduce the number to too few to be meaningful).It's frustrating seeing newer orders than mine that are scheduled for production, so I dug a little deeper into the spreadsheet. Filtered for orders similar to mine (premium AWD ER in California) I find that the proportion showing scheduled production dates seems sort of consistent through May/June time frame then falls off. Unfiltered (i.e. all orders), the falloff seems to be about the same.
What does this mean? I can hope that my early June order will be scheduled soon.
Sponsored
Similar threads

- Replies
- 11
- Views
- 5,684