Mach E Fast Charging Rate

louc757

Well-Known Member
First Name
Lou
Joined
Sep 3, 2022
Threads
2
Messages
87
Reaction score
98
Location
Louisville, KY
Vehicles
21 F150 Lariat, 23 MME GTPE Rapid Red Nite Pony
Occupation
Pilot
Country flag
I have had my Mach E for about a month now. I have been using it for commuting to work, and have been charging mostly at home. I did a fast charge at the EA facility in Clarksville, IN just to make sure it worked, and my Ford 250 kWh worked as well. The rate was lower than I thought.

I live in Lousivlle, KY and I have a trip to St Louis I would like to take in the MME, and I was curious how much time to budget for charging stops. I plan on charging to 100% at home for this trip. The first stop from my house to the EA in Clarksville is about 20 miles. It took me about 8% to get there. I wanted to see how long it would take to get from about 92% to 95-97%. The next stop is the EA facility in Mt Vernon, IL. It is about 186 miles from Clarksville, IN on I-64, and no other L3 chargers are on I-64 along the way. I could detour if needed, but that is not optimum. The L3 in Jasper, IN is a 34 mile round trip detour and only 50kW, the one in Evansville is a 60 mi round trip detour.

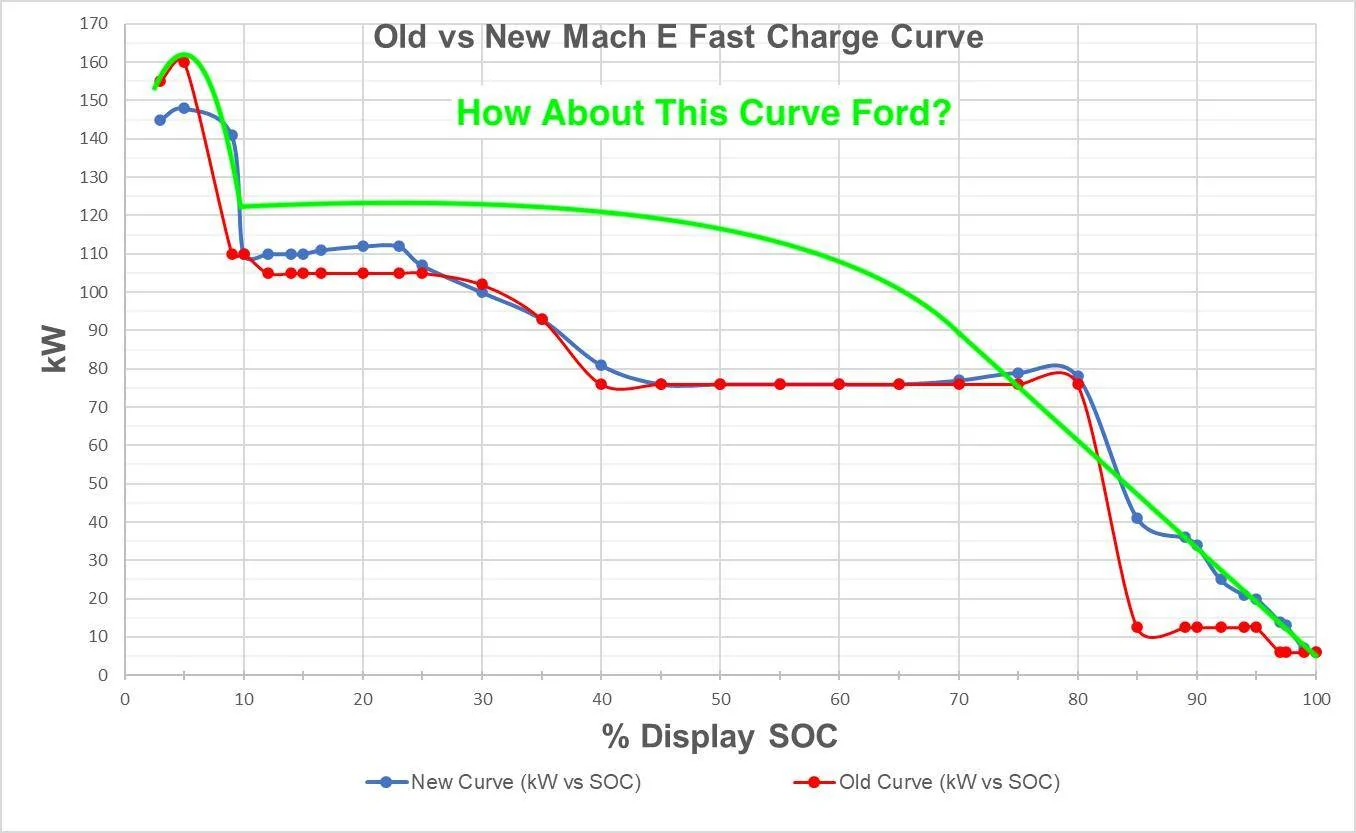
So, I drove to car to get the car down as low a charge as I was comfortable with, and got it to 3% SOC on the display. I then settled in for a long charge all the way to 100%, and got my pencil ready to chart this. I know the Ford updated the charging rate last fall, but couldn't find any data, so I plotted my own. Conditions at th time was 48 deg F outside temperature, battery temperature started at 51.8 deg.

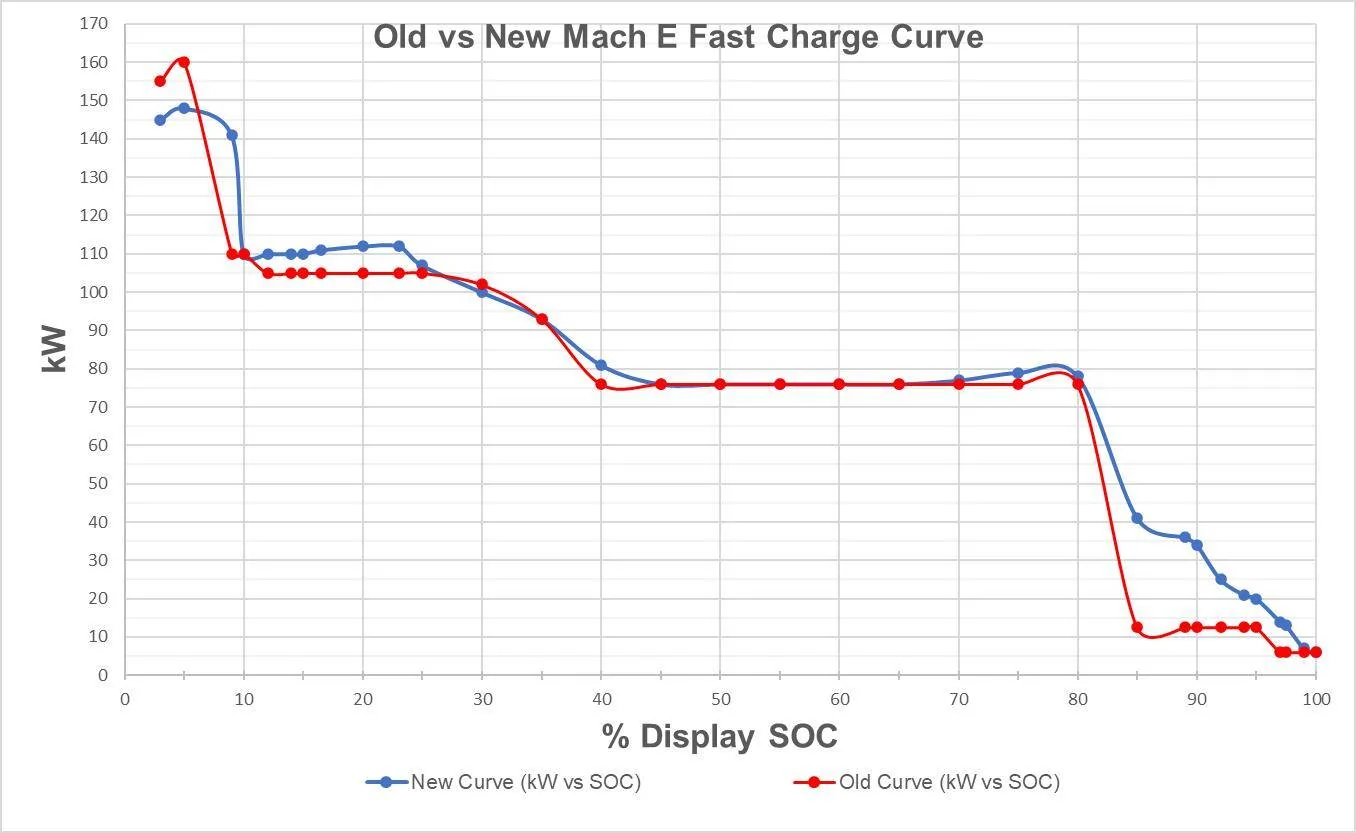
This first chart shows the new rate compared to the old rate that Inside EVs has posted. I overlayed the 2 to see how closely it matched up. It matches well until 80%, then is a big improvement to about 95%. The battery temperature at the end (100%) was 87.8 deg Fand outside temp was 46 deg.

Ford Mustang Mach-E Mach E Fast Charging Rate 1673650238941


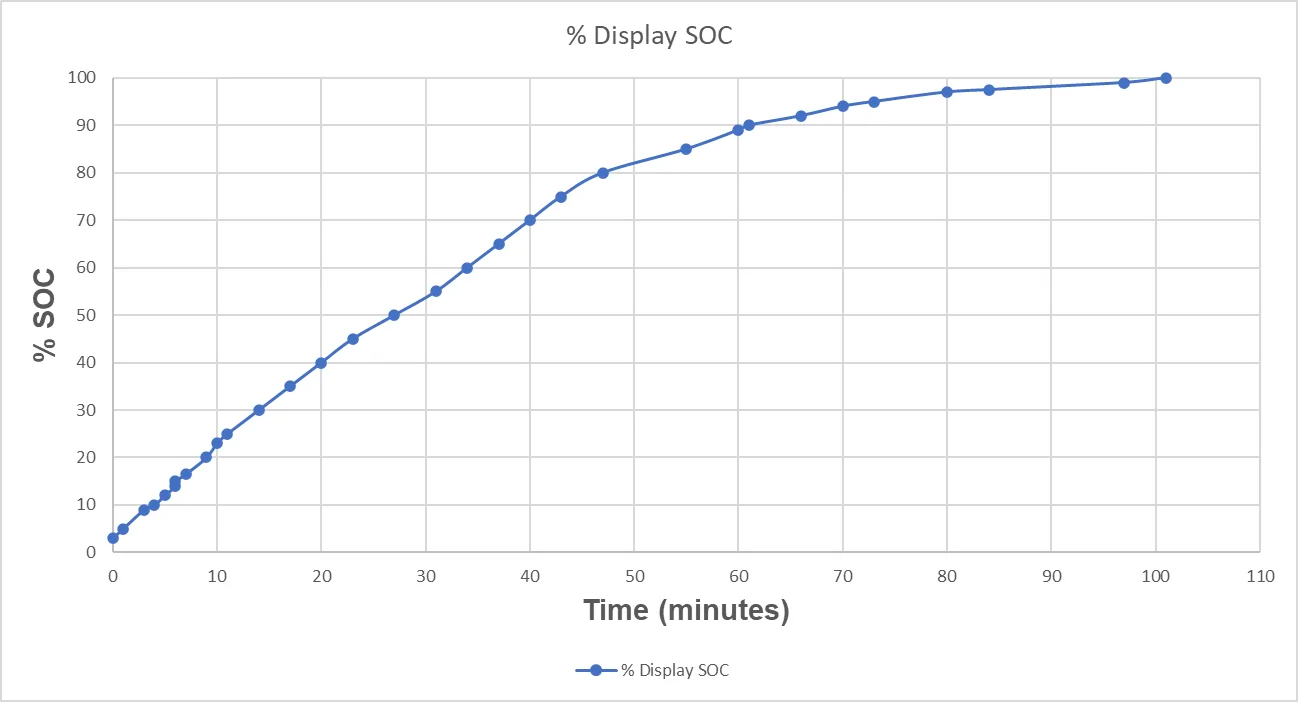
Overall, it took me 1 hour and 41 minutes to charge from 3% to 100%. Of course, the last 5% was the slowest. Here is a plot of the time it took from 3% to 100%. I've extrapulated charging from different points, say 20-80% and how much time it will take. Here is what I came up with. Maybe others who have done this can see if matches what they've seen. Of course, temperature can change these estimates.
  • 20%-80% - 38 minutes
  • 20%-85% - 46 minutes
  • 92%-95% - 7 minutes
  • 92% - 97% - 14 minutes (for that top off before my long leg to Mt Vernon)

Ford Mustang Mach-E Mach E Fast Charging Rate 1673650498925


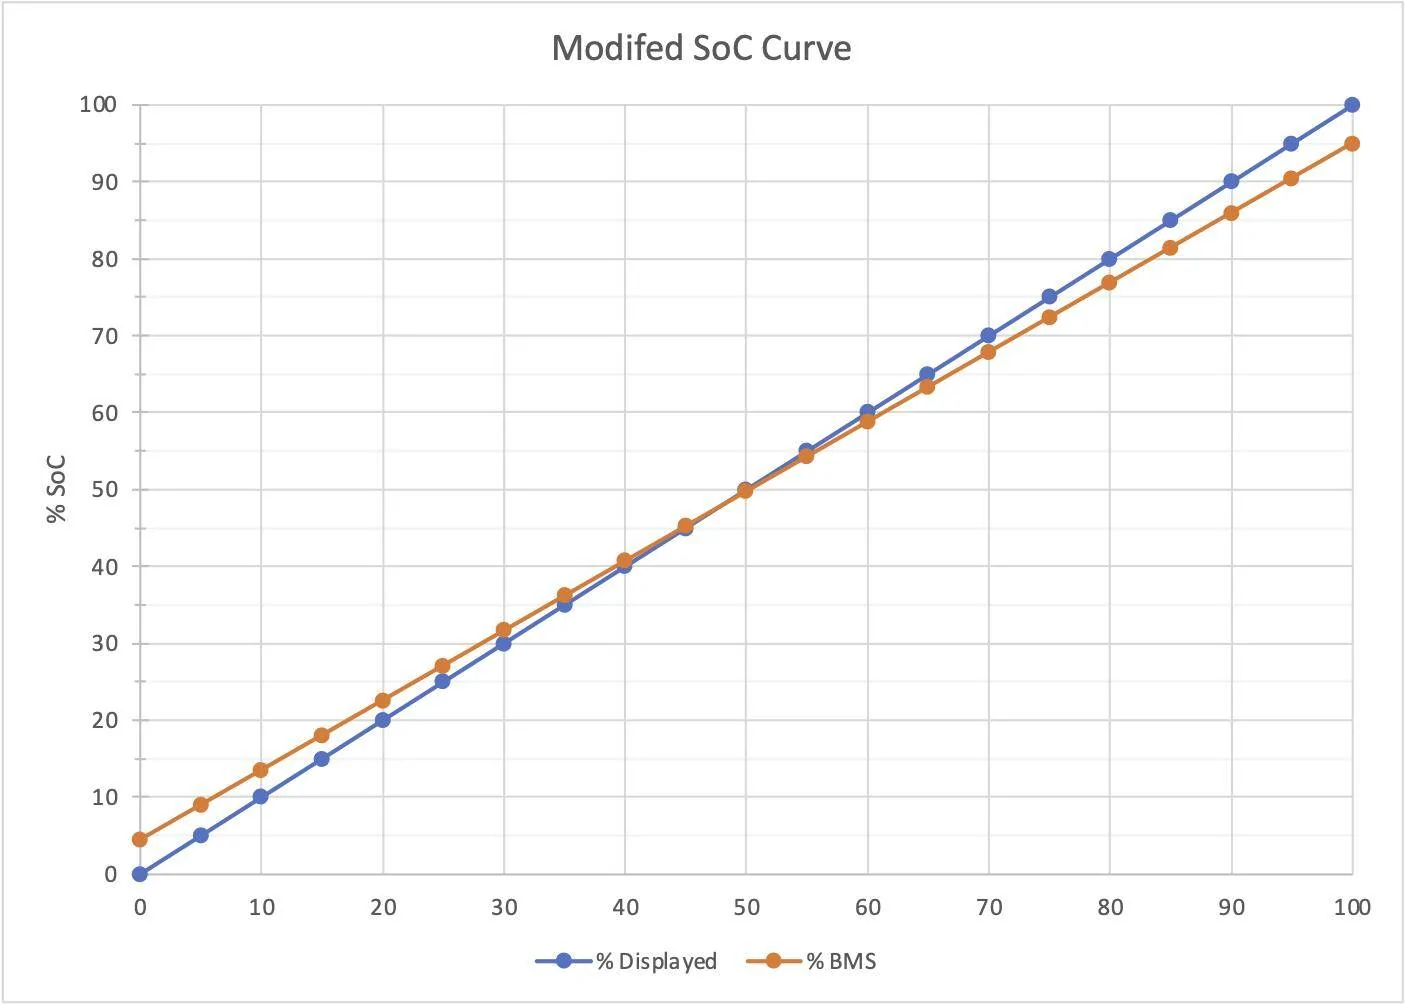
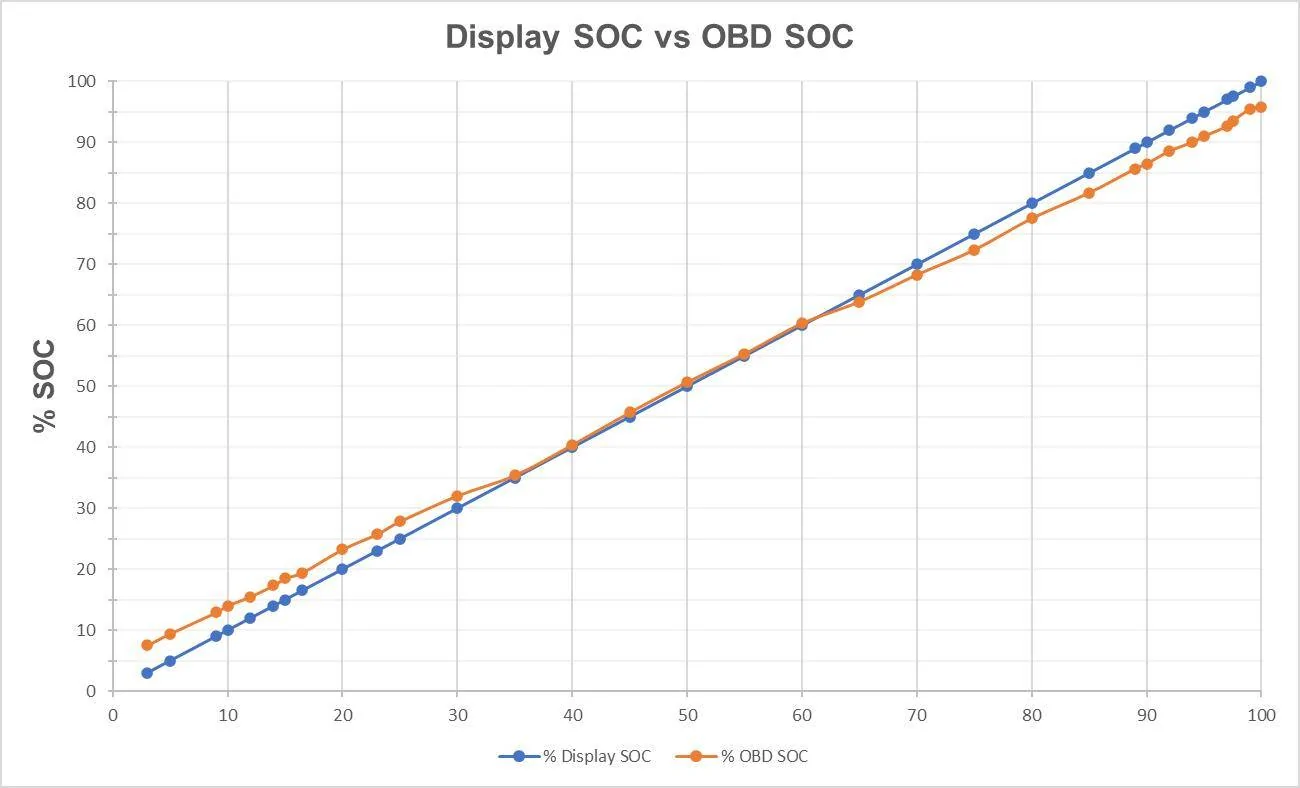
The last chart is interesting. I had my VLink OBD2 plugged in monitoring the charge, and observed when I first started, the display SOC was 3%, but the OBD said the car reported 7.48%. It reads higher than the displayed SOC below 35%. It matches from about 35% to 60%, but then it goes the other way. The displayed SOC is lower than what the OBD2 says it is from 60%-100%. So as others have said here, a displayed SOC of 100% is about 95-97% if you read it from the OBD.

Ford Mustang Mach-E Mach E Fast Charging Rate 1673651690546


1673651610477.png
 

Mach-Lee

Well-Known Member
First Name
Lee
Joined
Jul 16, 2021
Threads
207
Messages
7,868
Reaction score
15,813
Location
Wisconsin
Vehicles
2022 Mach-E Premium AWD
Occupation
Sci/Eng
Country flag
Thanks for sharing your data. It's interesting how the BMS SoC is perfectly locked to the displayed SoC from 35% to 60% but then makes a deviation above and below that. Why not make it a straight line the whole time?

Your data does a good job showing the differences between the old and new curves, but to me it's still a poor charging curve. Why not make the whole thing a nice smooth curve? Battery cells don't suddenly change character at a specific percentage like 80%. When there are giant quantized steps like that, I know the curve was programmed from a data sheet, and more optimization can be made until the curve is smooth. Such as this:

Ford Mustang Mach-E Mach E Fast Charging Rate Charging Curve


After the initial 500A overboot, the rest of the curve should be smooth with no giant drops as it tapers down to almost nothing at 100%. That would probably take about 5 minutes off the charge times. They should focus on getting the 20-80% time down to 30 minutes with an updated curve, I think that is possible with some tweaking.
 

Blue highway

Well-Known Member
First Name
Steve
Joined
Oct 15, 2021
Threads
4
Messages
2,119
Reaction score
3,274
Location
Oregon
Vehicles
Mach E Premium SR RWD
Country flag
Thanks for sharing your data. It's interesting how the BMS SoC is perfectly locked to the displayed SoC from 35% to 60% but then makes a deviation above and below that. Why not make it a straight line the whole time?

Your data does a good job showing the differences between the old and new curves, but to me it's still a poor charging curve. Why not make the whole thing a nice smooth curve? Battery cells don't suddenly change character at a specific percentage like 80%. When there are giant quantized steps like that, I know the curve was programmed from a data sheet, and more optimization can be made until the curve is smooth. Such as this:

Ford Mustang Mach-E Mach E Fast Charging Rate Charging Curve


After the initial 500A overboot, the rest of the curve should be smooth with no giant drops as it tapers down to almost nothing at 100%. That would probably take about 5 minutes off the charge times. They should focus on getting the 20-80% time down to 30 minutes with an updated curve, I think that is possible with some tweaking.
Why not make it a straight line the whole time? - The differences at the top and bottom of pack are the buffer, as I am sure you know... the lines cross at the 50% SOC, the difference between the buffer ramp and actual SOC is really small for the center third... someone likely asked, so why not make the the actual SOC? Either way it makes no material difference.
 

bshaw

Well-Known Member
Joined
May 18, 2020
Threads
12
Messages
1,307
Reaction score
1,780
Location
Boston, MA
Vehicles
2021 Mustang Mach E 4X (Job 1)
Country flag
Why not make it a straight line the whole time? - The differences at the top and bottom of pack are the buffer, as I am sure you know... the lines cross at the 50% SOC, the difference between the buffer ramp and actual SOC is really small for the center third... someone likely asked, so why not make the the actual SOC? Either way it makes no material difference.
Yes, agreed.

On the top end, they need to hide the buffer as additional capacity you can't access. On the low end, its additional hidden charge that you can't use. Based on how others have described the way the buffer works, the intersection of the Display SOC vs. Actual SOC lines are exactly like I would expect them to be. To do it any other way, and you'd have to either eliminate the buffer, or make either 100% or 0% inaccessible to the operator.
 

MellowJohnny

Well-Known Member
First Name
Christian
Joined
Nov 16, 2021
Threads
69
Messages
1,288
Reaction score
2,054
Location
YYZ
Vehicles
2022 Mach-E Premium AWD
Occupation
Solution Architect
Country flag
Why the initial spike right at the start of the session? I’ve always wondered why it starts that way, then settles in. Does it have to do with pack voltage when the pack is at a low SOC?


bshaw

Well-Known Member
Joined
May 18, 2020
Threads
12
Messages
1,307
Reaction score
1,780
Location
Boston, MA
Vehicles
2021 Mustang Mach E 4X (Job 1)
Country flag
Why the initial spike right at the start of the session? I’ve always wondered why it starts that way, then settles in. Does it have to do with pack voltage when the pack is at a low SOC?
My guess is that Ford wanted to spec the highest number possible as the "max DCFC charge rate". That spec is 150kW for extended range, but its just a burst and then tapers quickly for battery preservation purposes. Standard battery is more like 115kW at the burst?
 

AZBill

Well-Known Member
First Name
Bill
Joined
May 26, 2021
Threads
12
Messages
1,497
Reaction score
1,765
Location
Arizona
Vehicles
Rivian R1T, Hummer EV SUT, MME CA Route 1
Occupation
Engineer
Country flag
Ford is using a time based curve, not an SoC based curve. I have seen mine peak at 150kw when starting at 48%. I have also seen it hold up to 90kw at 80% before the drop off, when starting the charge later. It only limits based on strictly SoC when it reaches 80%. I have started charging at 60-70% and it will start above 100kw.
 

Deleted member 16048

Guest
Just want to add that generally why you see the sudden drops and changes would be due to pack temp. Moving all that power creates heat, so that needs to be managed correctly. Having the high curve would be ideal, but then there would need to be a much better hardware system to control the heat. Which adds more weight, and less range based on that current pack size. Lots of factors at play really.

This happens with iPhone as well but on a much smaller scale. If your phone gets too hot, the speed in which it charges will slow, and once it cools it will speed up a bit.

I usually used filling a school bus full of kids as a way to explain it. You can have them run in really fast, but as it gets more full they slow down. But if you slow them down yourself you can make it less chaotic inside so everyone finds a space more efficiently.

Engineering usually has a reason for the madness. Lithium is just a picky material, can't wait until we get to a solution that can scale well, and bring the cost down.
 
OP
OP
louc757

louc757

Well-Known Member
First Name
Lou
Joined
Sep 3, 2022
Threads
2
Messages
87
Reaction score
98
Location
Louisville, KY
Vehicles
21 F150 Lariat, 23 MME GTPE Rapid Red Nite Pony
Occupation
Pilot
Country flag
Thanks for sharing your data. It's interesting how the BMS SoC is perfectly locked to the displayed SoC from 35% to 60% but then makes a deviation above and below that. Why not make it a straight line the whole time?
I agree with you. I expected the BMS SOC to be the same of the same difference from 0 all the way to 100%, not invert after 60%. I think the engineers wanted to encourage people to find a charger sooner, so the SOC displayed is lower than the BMS SOC, so many people aren’t stranded by pushing it. They may want to limit a full battery at 100% displayed SOC, so BMS SOC is actually is a little less than displayed.

Your data does a good job showing the differences between the old and new curves, but to me it's still a poor charging curve. Why not make the whole thing a nice smooth curve? Battery cells don't suddenly change character at a specific percentage like 80%. When there are giant quantized steps like that, I know the curve was programmed from a data sheet, and more optimization can be made until the curve is smooth. Such as this:
Lee, your spot on! It should be able to hold a higher kW longer. I know Ford was being conservative, but Tesla increased their charging rate from 200 kW up to 250 kW last April, and stays above 100 kW until over 50%. Ford can safely up the curve without decreasing battery life. I think it is overly conservative right now. One of the things the MME is weak on is L3 charging rate. Car and driver did a review of many different ones, and the MME has some of the slowest charging times.
 

Mach-Lee

Well-Known Member
First Name
Lee
Joined
Jul 16, 2021
Threads
207
Messages
7,868
Reaction score
15,813
Location
Wisconsin
Vehicles
2022 Mach-E Premium AWD
Occupation
Sci/Eng
Country flag
On the top end, they need to hide the buffer as additional capacity you can't access. On the low end, its additional hidden charge that you can't use. Based on how others have described the way the buffer works, the intersection of the Display SOC vs. Actual SOC lines are exactly like I would expect them to be. To do it any other way, and you'd have to either eliminate the buffer, or make either 100% or 0% inaccessible to the operator.
This is how I would have done it, as a perfect linear function:

Ford Mustang Mach-E Mach E Fast Charging Rate SoC Curve


Yeah it's pretty close to how it is, but it would actually be more programming to have it match in some places but not others. With the reported actual curve, when you're driving you would see a faster % drop in the 30-35% region as the curve "falls behind" the actual SoC. I know it's not a big deal, but it just seems like added strangeness to me.

Why the initial spike right at the start of the session? I’ve always wondered why it starts that way, then settles in. Does it have to do with pack voltage when the pack is at a low SOC?
Since the busbars aren't warm in the pack yet at DC charging start, you can do an "overboot" for a few minutes until the busbars and cells start to get warm. Basically it shortens the time it takes to reach thermal equilibrium with the busbar temps, and can easily shave a few minutes off the charging time. Almost all the OEMs have something similar where it will go full power the first few minutes and then it drops down to a "max continuous" type rate. You will get that overboot rate for several minutes pretty much regardless of the initial SoC of the pack.
 

Mach-Lee

Well-Known Member
First Name
Lee
Joined
Jul 16, 2021
Threads
207
Messages
7,868
Reaction score
15,813
Location
Wisconsin
Vehicles
2022 Mach-E Premium AWD
Occupation
Sci/Eng
Country flag
Lee, your spot on! It should be able to hold a higher kW longer. I know Ford was being conservative, but Tesla increased their charging rate from 200 kW up to 250 kW last April, and stays above 100 kW until over 50%. Ford can safely up the curve without decreasing battery life. I think it is overly conservative right now. One of the things the MME is weak on is L3 charging rate. Car and driver did a review of many different ones, and the MME has some of the slowest charging times.
Agree. Yeah I really think it should be able to do 120+ kW for a while (like from 10-50%), and that shouldn't damage the pack. It can handle more than it does now and still meet the warranty targets IMO. It's just funny how they're super conservative about the DC charging curve, but very liberal when it comes to allowing huge amounts of regen when the pack is below freezing (not great for the pack). Also the lack of heating the pack to a decent temperature before giving a high DCFC rate. I think the Mach-E charges faster than any other EV (in terms of C rate) with a 0ÂşF pack temp, which isn't a good thing.
 
Last edited:

kltye

Well-Known Member
Joined
May 21, 2021
Threads
17
Messages
883
Reaction score
1,394
Location
Chicago
Vehicles
IB MME Premium RWD
Country flag
Just want to add that generally why you see the sudden drops and changes would be due to pack temp. Moving all that power creates heat, so that needs to be managed correctly. Having the high curve would be ideal, but then there would need to be a much better hardware system to control the heat. Which adds more weight, and less range based on that current pack size. Lots of factors at play really.

This happens with iPhone as well but on a much smaller scale. If your phone gets too hot, the speed in which it charges will slow, and once it cools it will speed up a bit.

I usually used filling a school bus full of kids as a way to explain it. You can have them run in really fast, but as it gets more full they slow down. But if you slow them down yourself you can make it less chaotic inside so everyone finds a space more efficiently.

Engineering usually has a reason for the madness. Lithium is just a picky material, can't wait until we get to a solution that can scale well, and bring the cost down.
Nothing to do with pack temps. I've charged at low pack temps, waited for the pack to warm up, and... nothing. Charging speed tops out at what the OP's graph shows. It tries to keep the pack at a max of ~98 degrees F, but I don't think the cooling system is the issue - certainly not in the middle of winter here.
 

Blue highway

Well-Known Member
First Name
Steve
Joined
Oct 15, 2021
Threads
4
Messages
2,119
Reaction score
3,274
Location
Oregon
Vehicles
Mach E Premium SR RWD
Country flag
Why the initial spike right at the start of the session? I’ve always wondered why it starts that way, then settles in. Does it have to do with pack voltage when the pack is at a low SOC?
Lithium batteries can be charged at the highest rate when the state of charge is the lowest as the state of charge rises, the heat generated in the cell by charging goes up for the same level of charging. If there is too much heat generated in the cell it will be damaged.

As a rule of thumb, they max out at 1-3X their capacity (known as C rate...) The MME caps this at 1.5C below ~30% SOC... as SOC rises, the charge rate is throttled back. Thus the max rate is only usable briefly as heat builds up in the cells.

two imperfect analogies...

The rate you can load people into a subway car is different if the car is nearly empty than if it is nearly full... When it's nearly full, there is more friction stuffing more people in.​
The rate you can fill an air compressor tank is faster when it is empty... as pressure builds, heat goes up and compressor has to work a lot harder.​

Generally speaking, the better the cell cooling the higher the charge rate that can be sustained, but there are other limits to the charge chemistry... eventually the charge rate has to be slowed or the cell life will be shortened.

The fixation on the peak charge rate in popular media is kinda misguided... The issue is not kWh charge rate max, its how long does it take to charge from 20-80%..... because the max C charge rate for cells means that bigger batteries may charge at a higher kWh rate, but the time to go from 20-80 is still the same as for smaller batteries.

Example... time to charge an SR MME and an ER car at a DCFC from say 30-70% is essentially the same even though the ER car charges at a higher kWh rate. This is because the 1.5C cap is the same and the charge curve is the same.
 
OP
OP
louc757

louc757

Well-Known Member
First Name
Lou
Joined
Sep 3, 2022
Threads
2
Messages
87
Reaction score
98
Location
Louisville, KY
Vehicles
21 F150 Lariat, 23 MME GTPE Rapid Red Nite Pony
Occupation
Pilot
Country flag
I'm not a battery expert like some on this forum, but I do know a little about Lithium-Ion batteries. As a cargo pilot, I am trained annually on different hazmat. I know the one thing you do not want is a thermal runaway in a battery. Once it starts in one cell, it will carry over to other cells and other batteries. So I understand limiting the power in recharging to prevent this.

To see how the Mach E compares to other vehicles, I plotted the Mach E against other 400V systems. I left out Porche and Audi since since they are 800V, and I wanted an apple-to-apple comparison. Disclaimer: I used charging curves I've found online (other than the MME) so I don't know the accuracy of the other vehicles. What I found was the Mach E was last (blue line). Taking into account not knowing the exact chemistry Ford uses in their batteries, I would say they still have room to increase the rate and stay safe doing it. Hopefully we'll get another OTA update to increase the rate this year.

That said, I love the car, and do not regret buying it. 99% of my driving is commuting to and from work. I would buy it all over again. However, on a really long trip in the winter, I would take my ICE F150. :p

Ford Mustang Mach-E Mach E Fast Charging Rate 1673727555832
Sponsored


Top