EVmodeler
Well-Known Member
- First Name
- Doug
- Joined
- Oct 30, 2020
- Threads
- 10
- Messages
- 132
- Reaction score
- 291
- Location
- SW Virginia
- Vehicles
- Mach-E AWD ER IB Job 1
- Occupation
- Engr Prof emeritus
- Thread starter
- #1
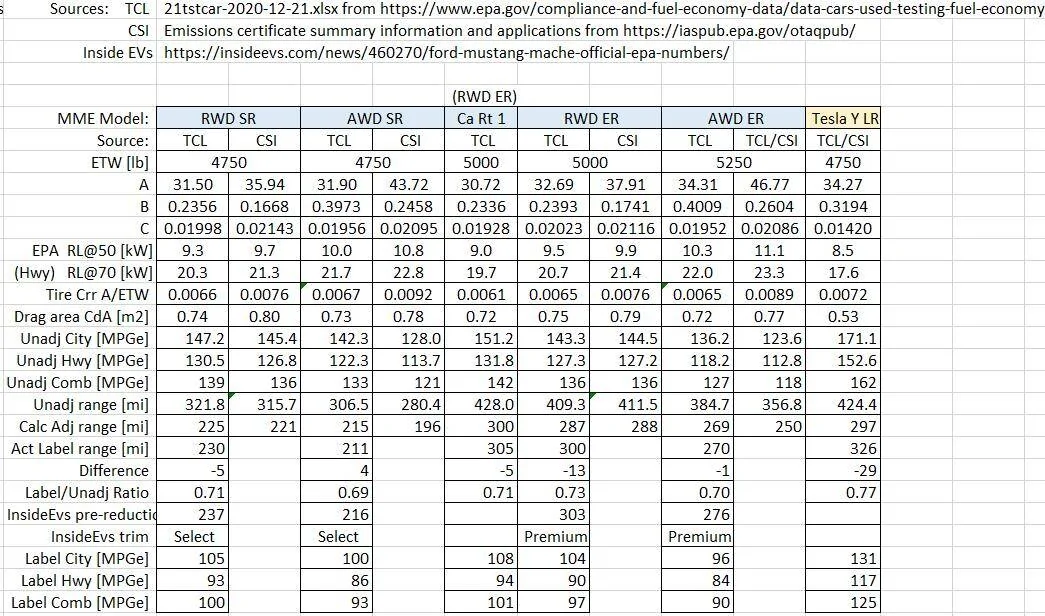
EPA has updated the test car list data for 2021 models, https://www.epa.gov/compliance-and-fuel-economy-data/data-cars-used-testing-fuel-economy
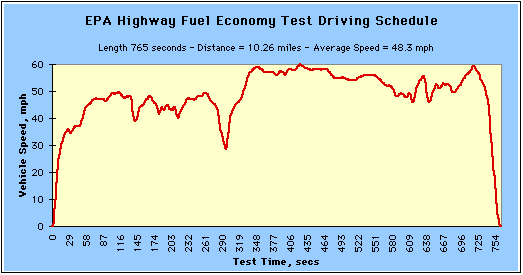
and now lists each of the RWD, AWD, SR and ER including the Cali Rt 1 model. This data has the unadjusted MPGe for city (UDDS) and HwFET cycles, and the target road load coefficients and test mass for each model. From this data, we can compare road load as a function of speed (haven't done it yet), and see what adjustment is used for the label values. Note that there are no extra cycles other than UDDS and HwFET listed.
There are also now emissions certification summaries and applications for the SR RWD and AWD models at
https://iaspub.epa.gov/otaqpub/
Sponsored
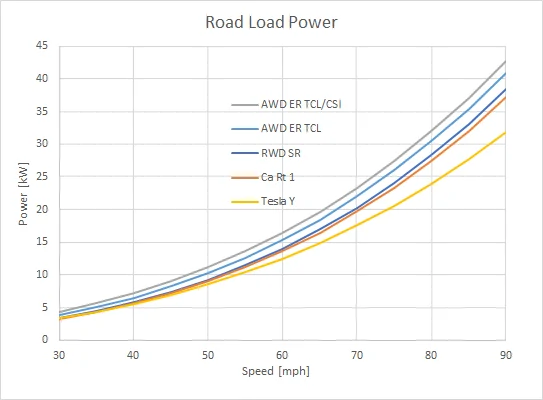
") The data is there in the table; you can plot it if it is of special interest.
The data is there in the table; you can plot it if it is of special interest.