RickMachE
Well-Known Member
- Joined
- Jul 1, 2021
- Threads
- 267
- Messages
- 17,926
- Reaction score
- 27,919
- Location
- SE MI
- Vehicles
- 2022 Mach-E Premium 4X, 2022 Lightning Lariat ER
- Thread starter
- #1
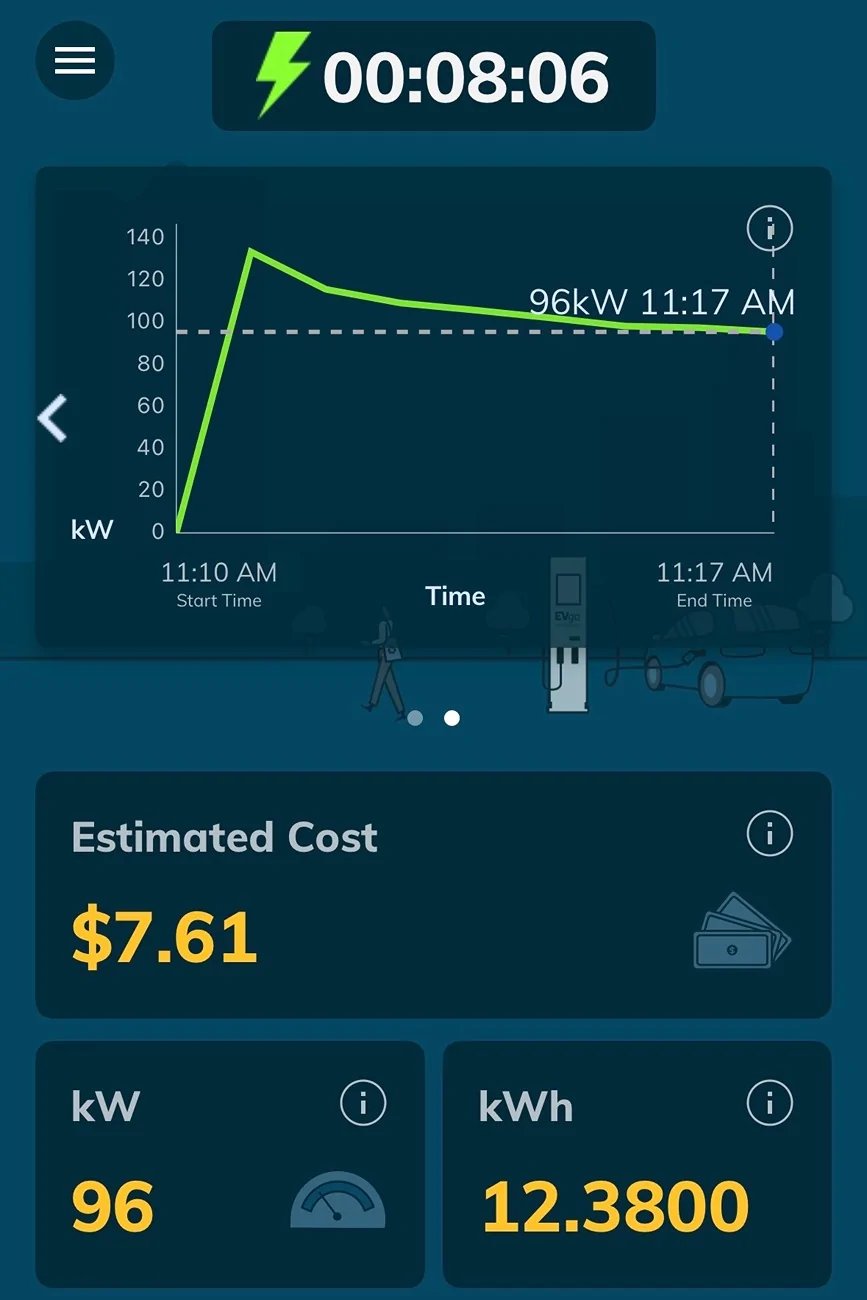
Over my long trip, I collected CarScanner data for each charging session. I'm interested in looking at (and posting) graphs of these sessions, with the battery temp and charging rate, illustrating the slower charging at colder temps.
In the app, I can display say 3 charging sessions over the day, all in one graph. But, I see no way to limit time, so that I can look at each charging session separately.
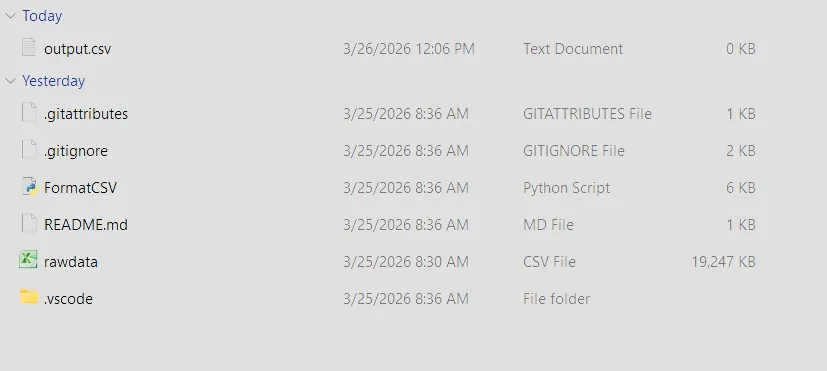
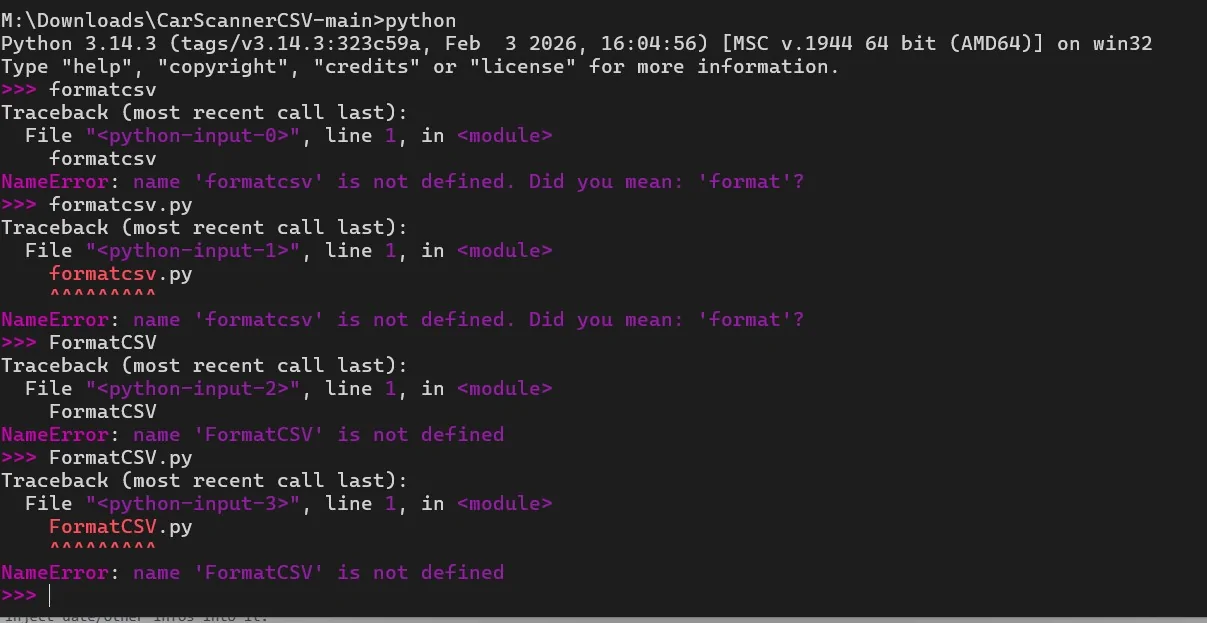
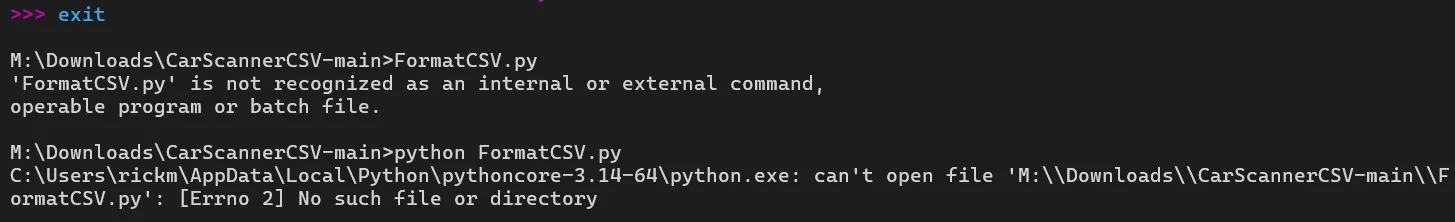
I found the script, FormatCSV.py, which removes other columns, but I get a syntax error when I run it (I have never used Python before). I type in Formatcsv.py -1 <rawdata> -o <output>
I have tried adding .csv to each file, and I still get a syntax error.
Thanks for any help.
Rick
In the app, I can display say 3 charging sessions over the day, all in one graph. But, I see no way to limit time, so that I can look at each charging session separately.
I found the script, FormatCSV.py, which removes other columns, but I get a syntax error when I run it (I have never used Python before). I type in Formatcsv.py -1 <rawdata> -o <output>
I have tried adding .csv to each file, and I still get a syntax error.
Thanks for any help.
Rick
Sponsored