SpaceEVDriver
Well-Known Member
- Joined
- Aug 26, 2021
- Threads
- 71
- Messages
- 2,651
- Reaction score
- 4,774
- Location
- Arizona
- Vehicles
- 2022 CA Route 1 AWD, ER; 2023 Lightning Lariat ER
- Occupation
- Planetary Science
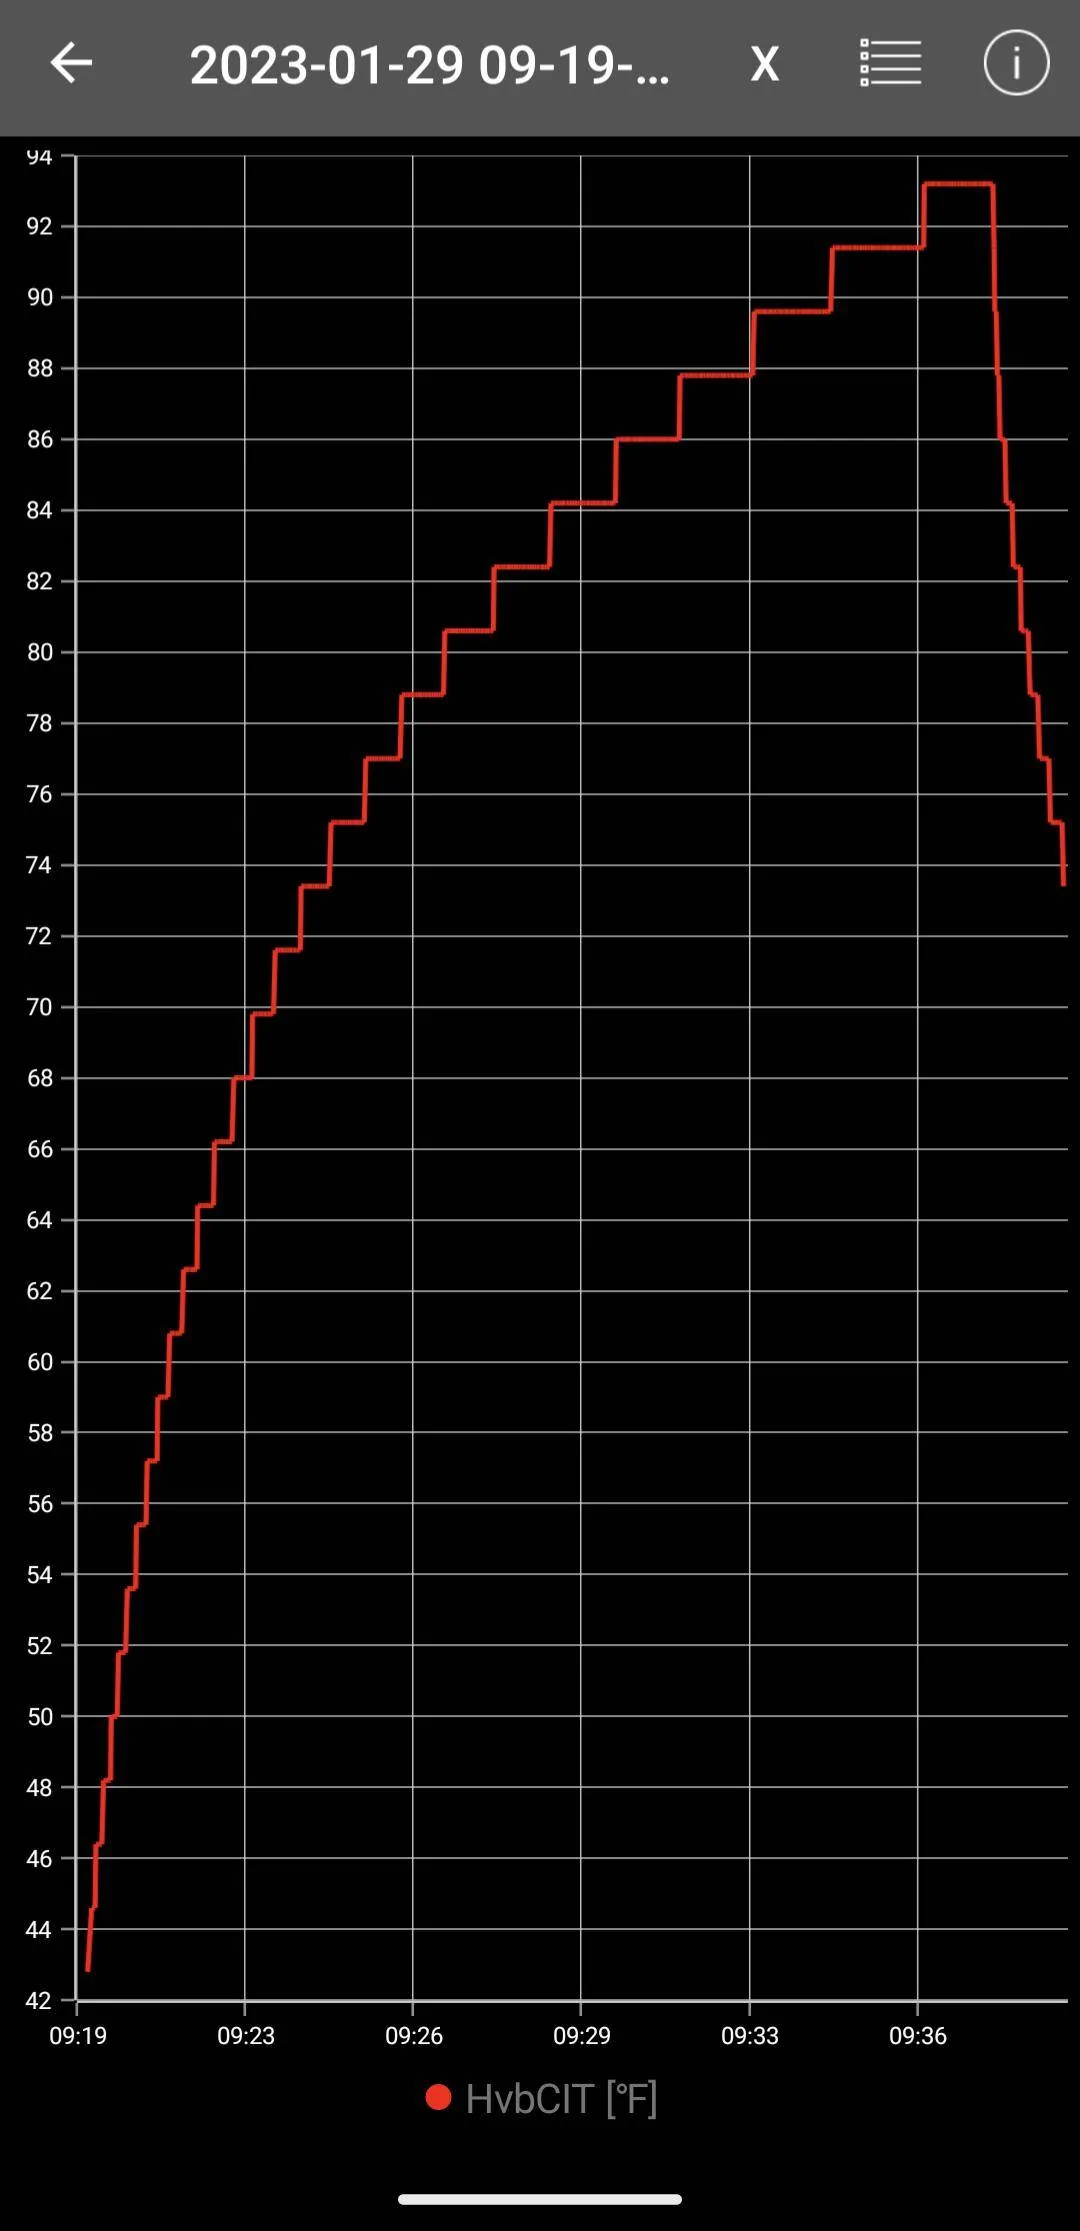
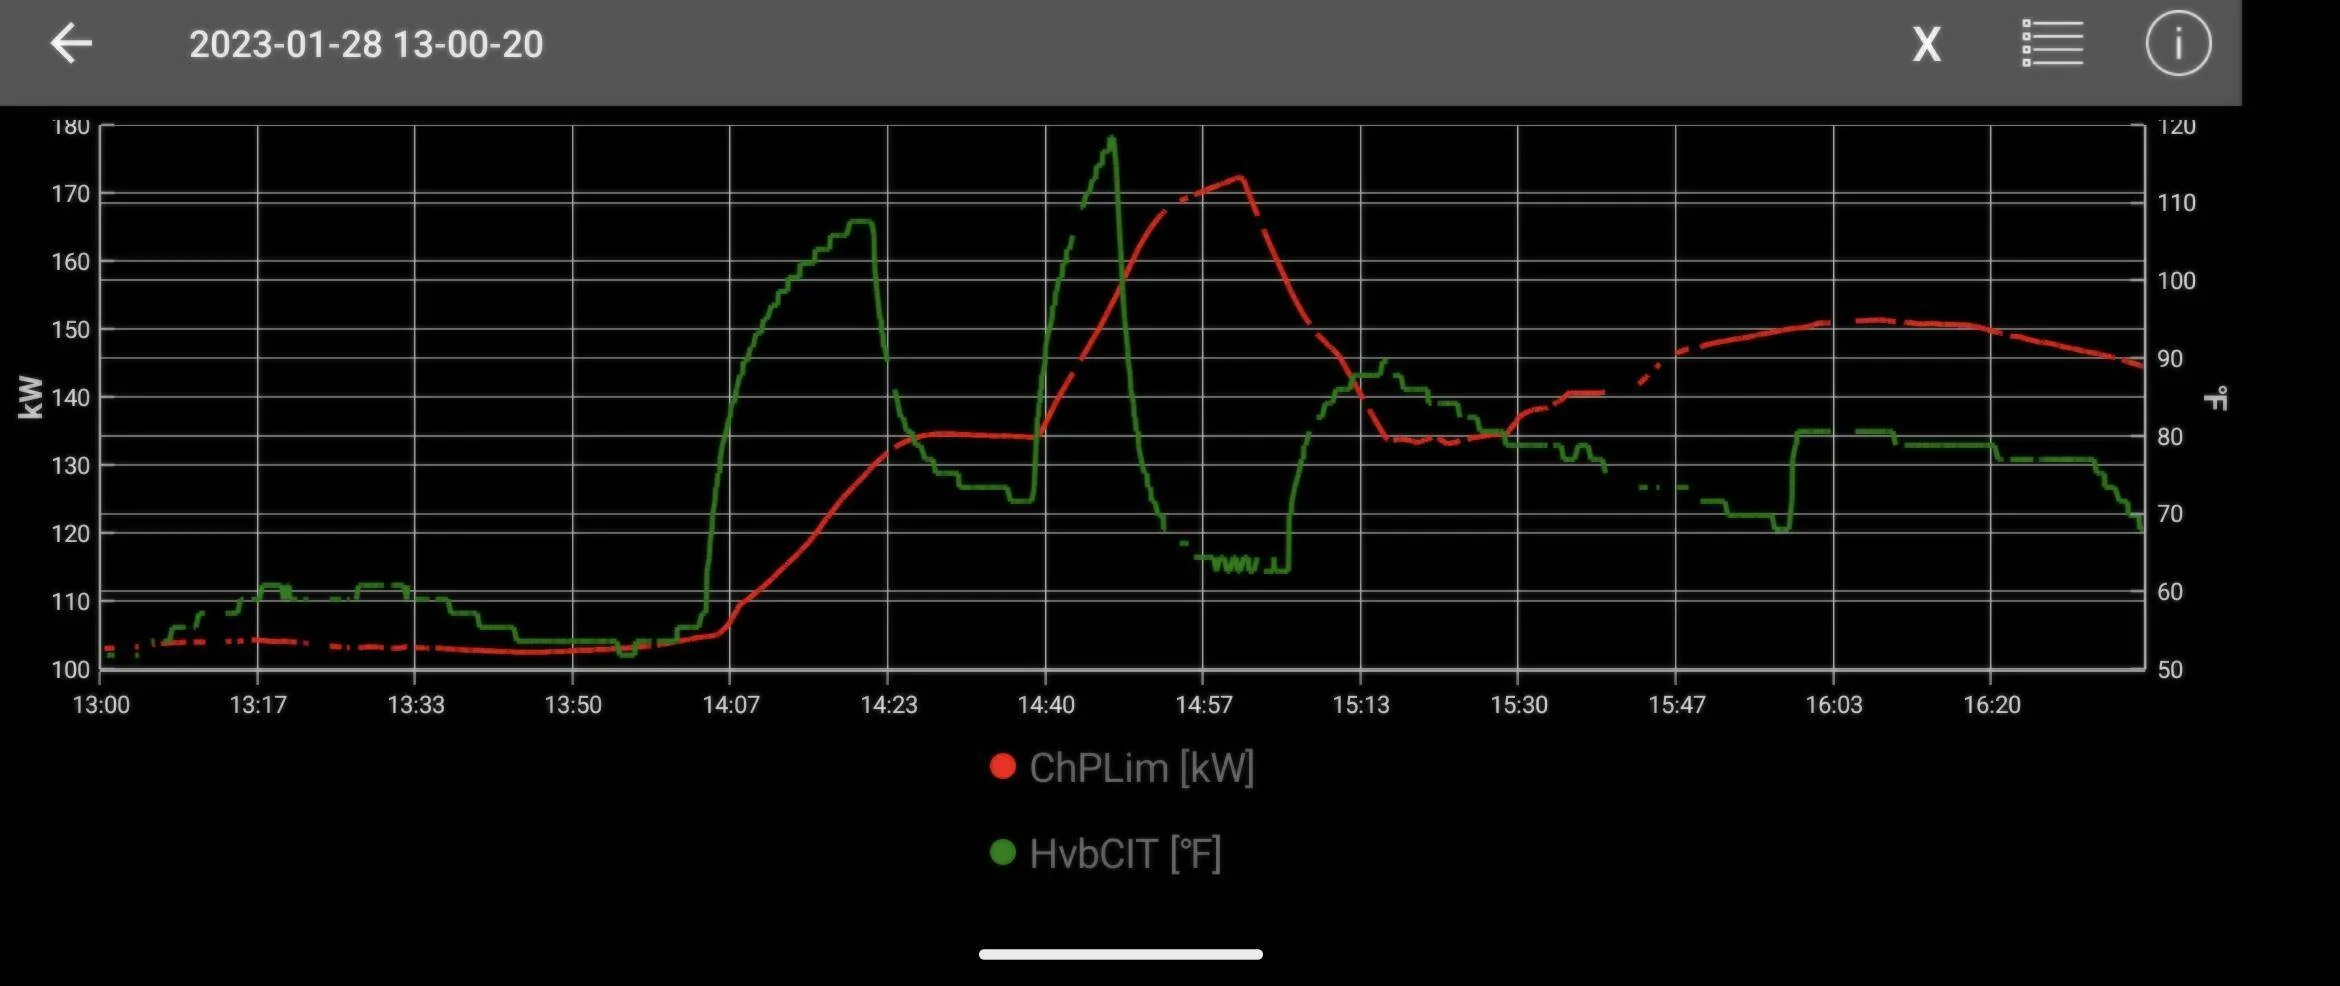
Another interesting graph from the trip I did yesterday. This time with direct evidence of improved charging rate at DCFC if using in-vehicle navigation.
I apologize for the bad color scheme, I don't know how to change colors in carscanner.
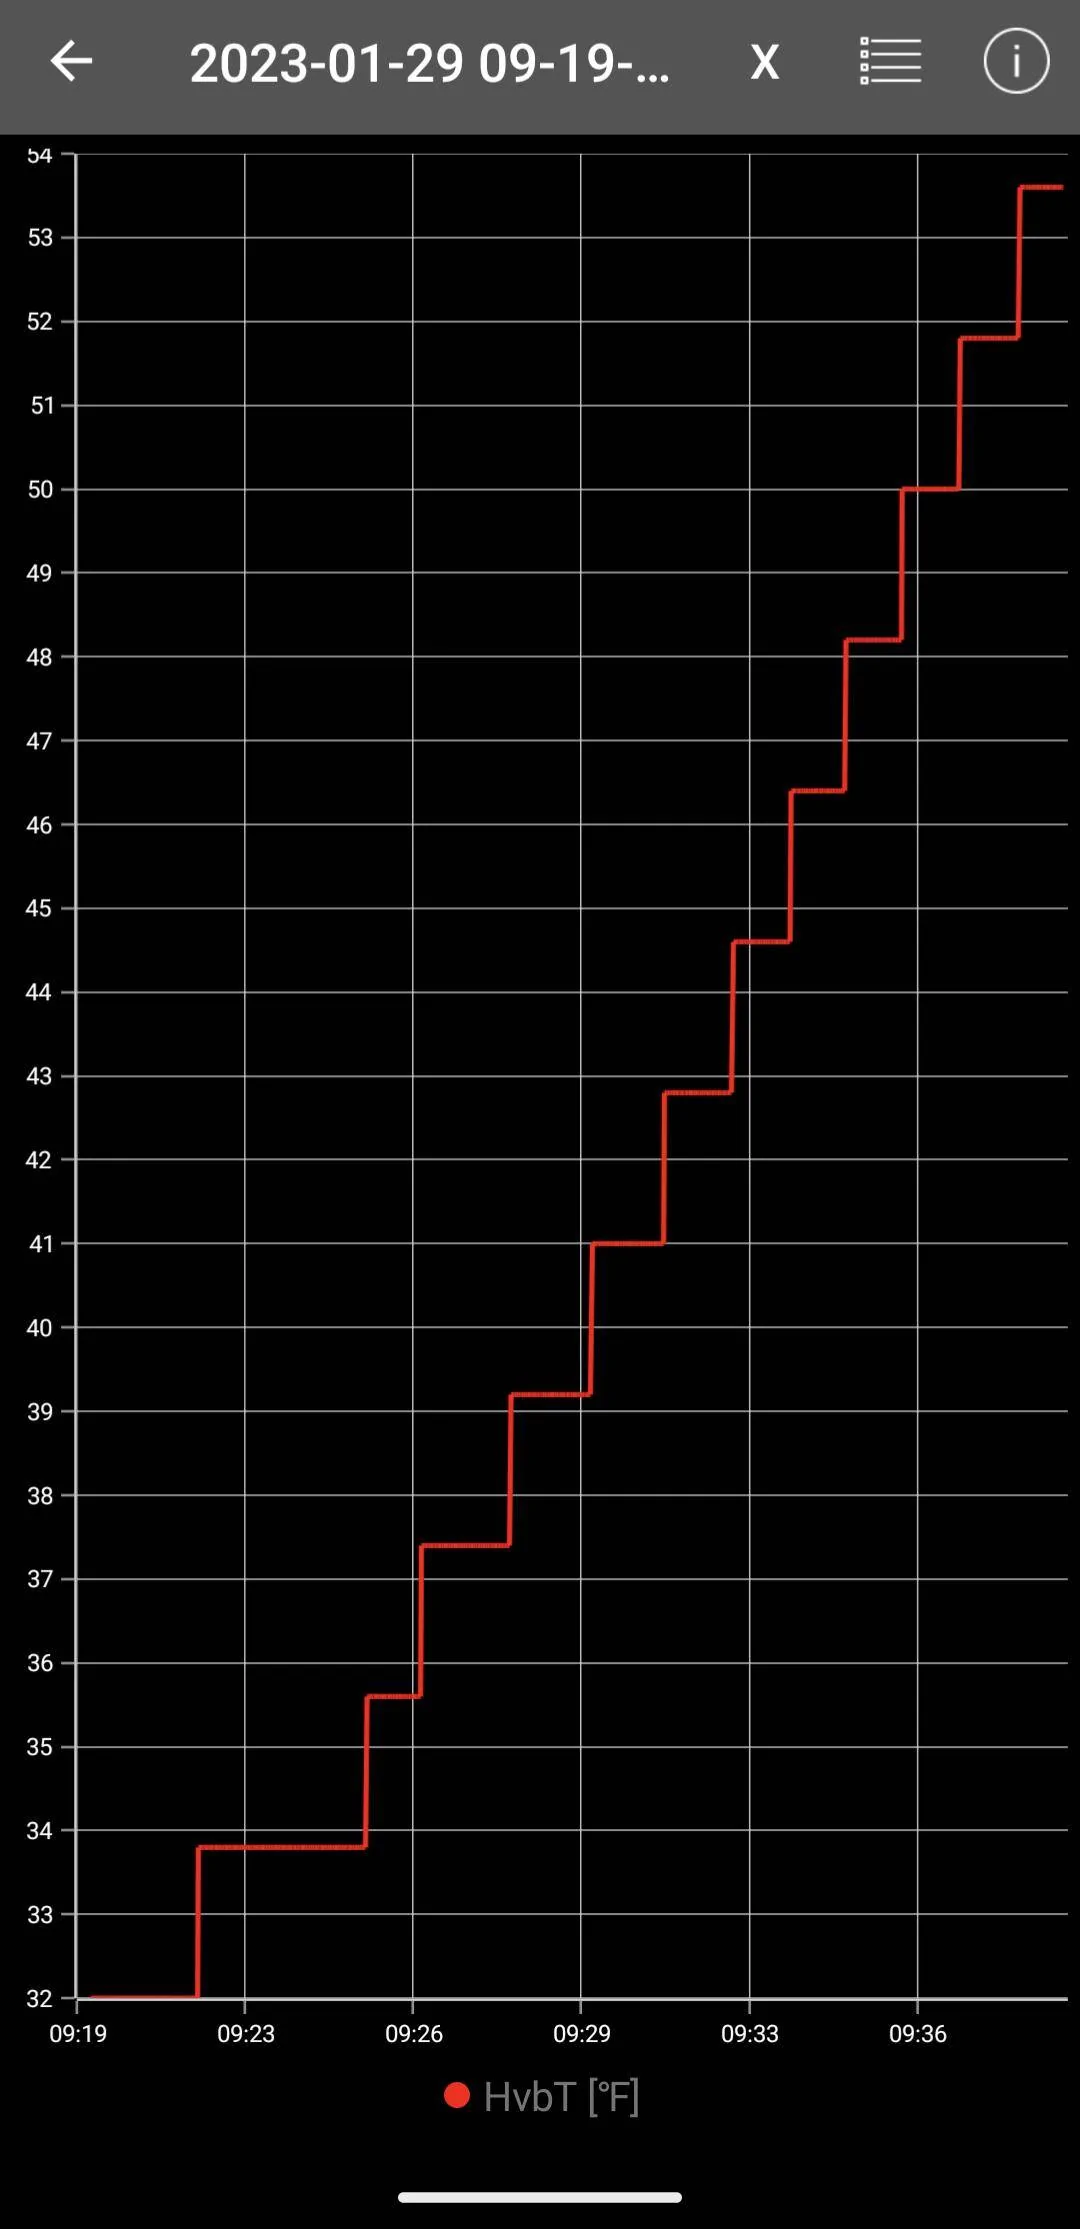
This is a plot of the inlet coolant temperature (green), and the charge power limit (red) as set by the car.
Just a little before 14:07 is when we were about 30 miles from the charging station. You can see the inlet temperature starts to increase rapidly. After a bit of a lag, the maximum charging power limit starts increasing and peaks around 170 kW.
[Edited to remove the power to/from the HVB since the plot without is much clearer.]

I apologize for the bad color scheme, I don't know how to change colors in carscanner.
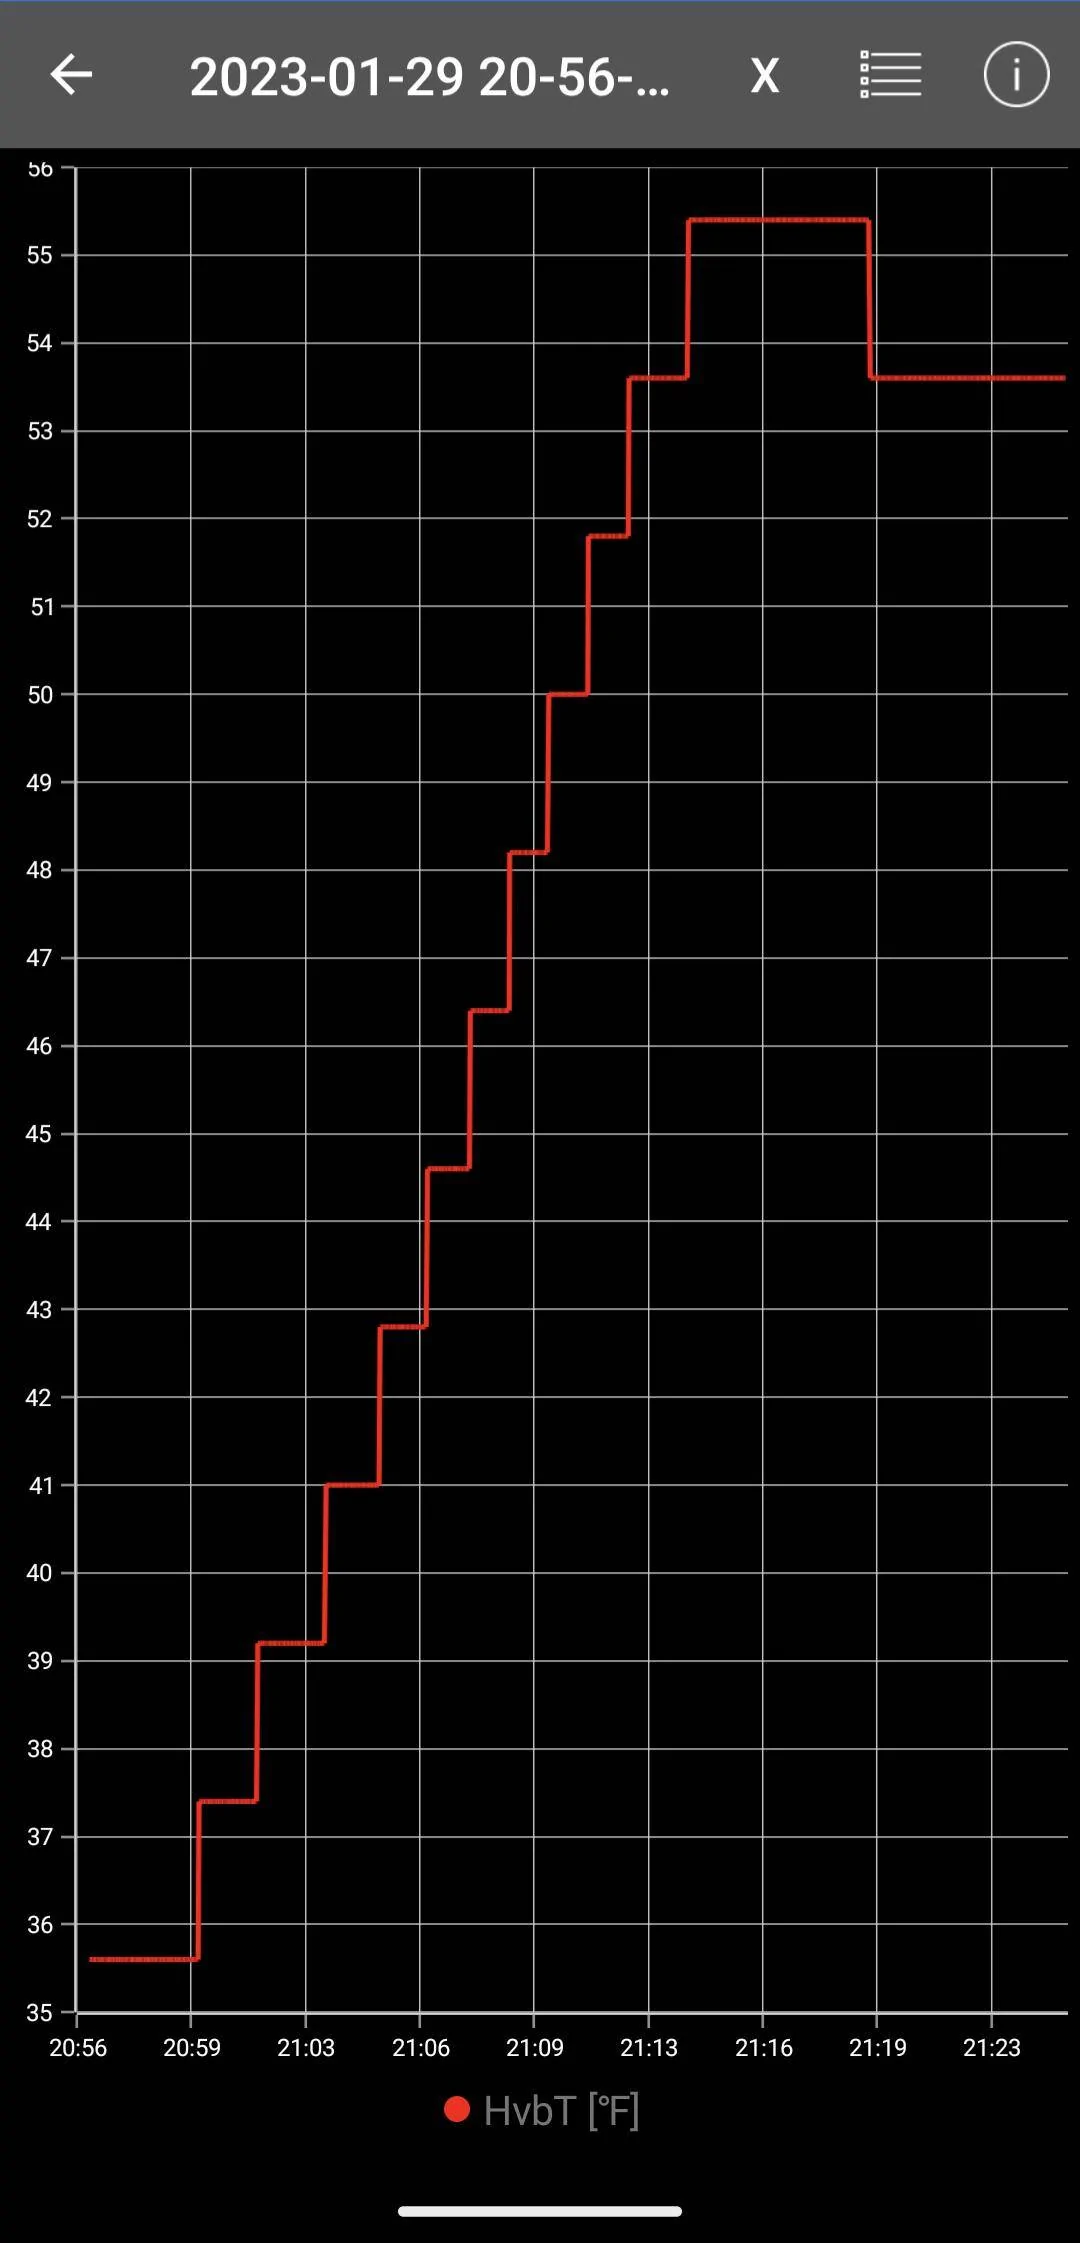
This is a plot of the inlet coolant temperature (green), and the charge power limit (red) as set by the car.
Just a little before 14:07 is when we were about 30 miles from the charging station. You can see the inlet temperature starts to increase rapidly. After a bit of a lag, the maximum charging power limit starts increasing and peaks around 170 kW.
[Edited to remove the power to/from the HVB since the plot without is much clearer.]
Sponsored
Last edited: