mkhuffman
Well-Known Member
- First Name
- Mike
- Joined
- Nov 19, 2020
- Threads
- 29
- Messages
- 6,878
- Reaction score
- 9,512
- Location
- Virginia
- Vehicles
- 2025 Rivian R1T Tri-Max, Jeep GC-L, VW Jetta
- Thread starter
- #1
When I first got my MME in November of 2021, I didn’t even consider tracking the High Voltage Battery (HVB) State of Health (SoH). But then last Fall, while tracking other data using a OBDII scanner, I noticed the SoH was much lower than the last time I noticed. I was kind of shocked with the drop.
Since then I have been mentioning this on the forum in various threads and it seems the SoH of my battery is lower than others. But it could be because I have more miles on the car. So I decided to go through all my old CarScanner data and see if I could track the SoH over time. Luckily I was able to find enough data to get a good trend.
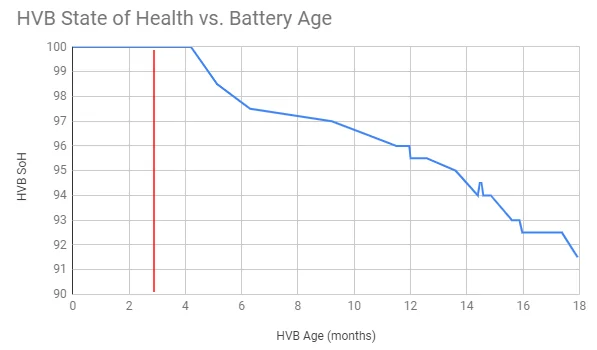
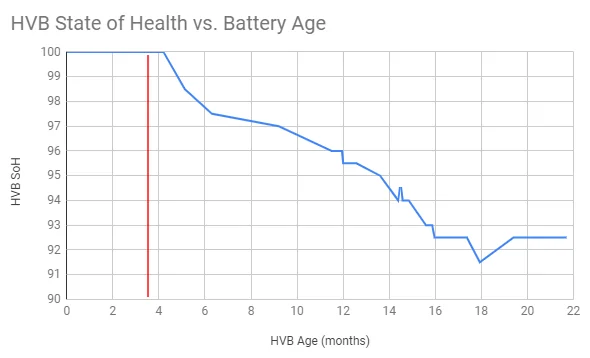
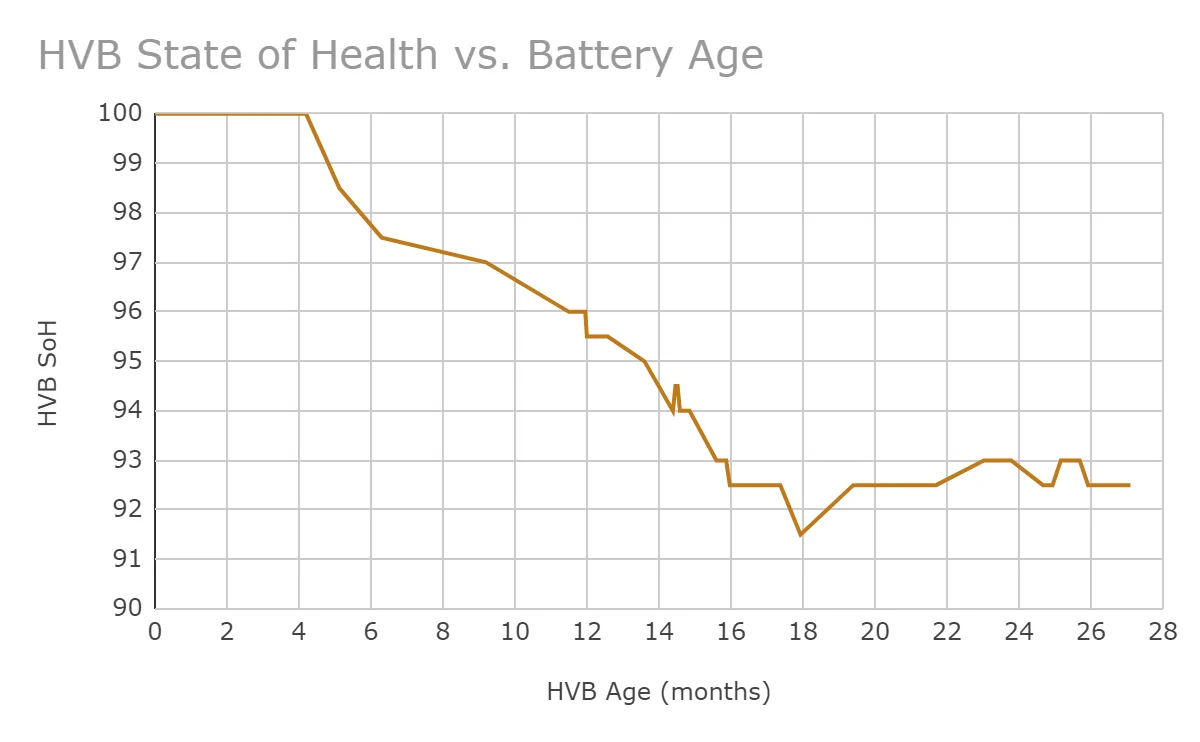
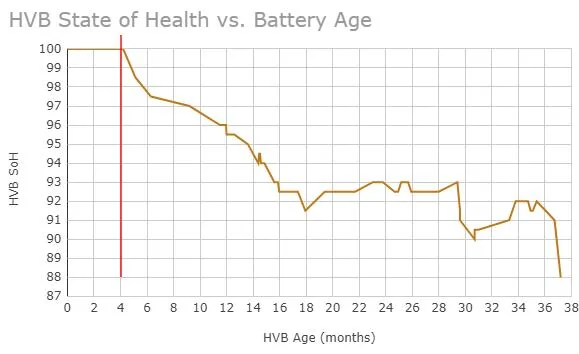
Below the SoH is graphed relative to battery age in months as of today. The red line is the day I took delivery of the car. (Yes, it sat in Mexico for a while.)

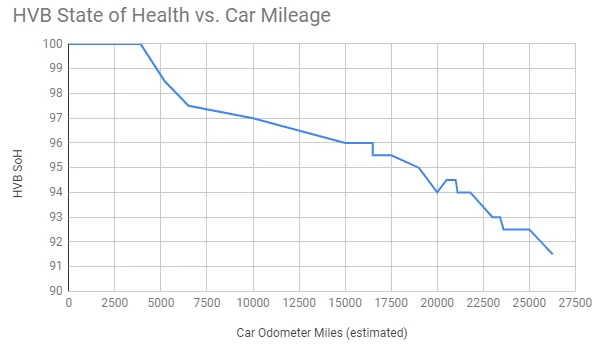
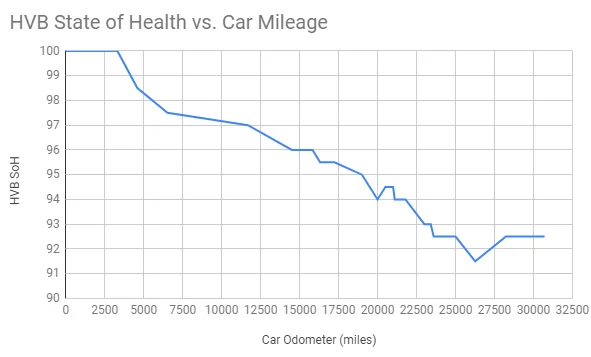
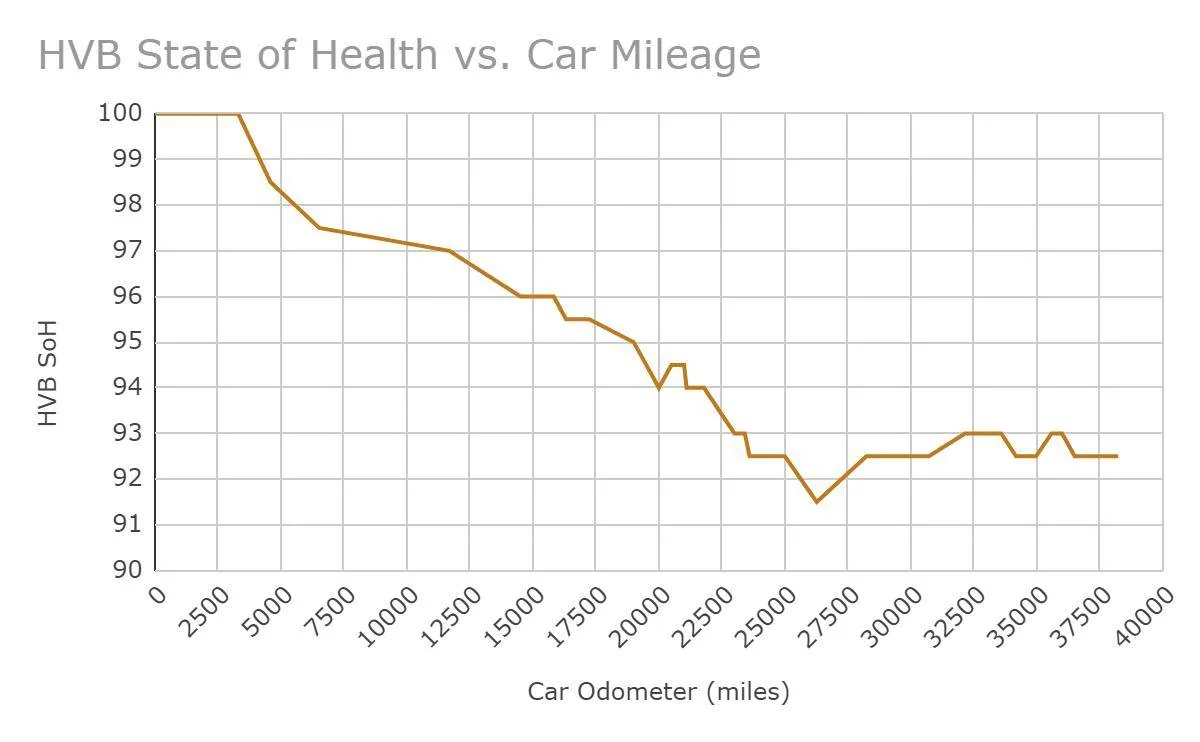
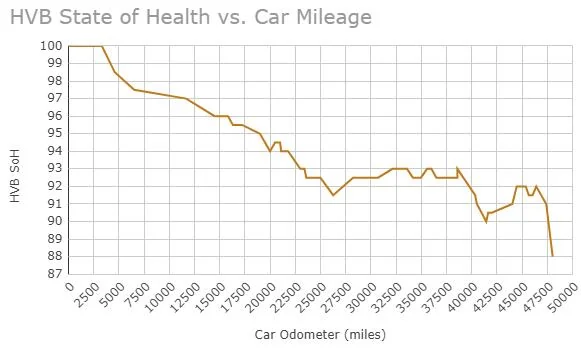
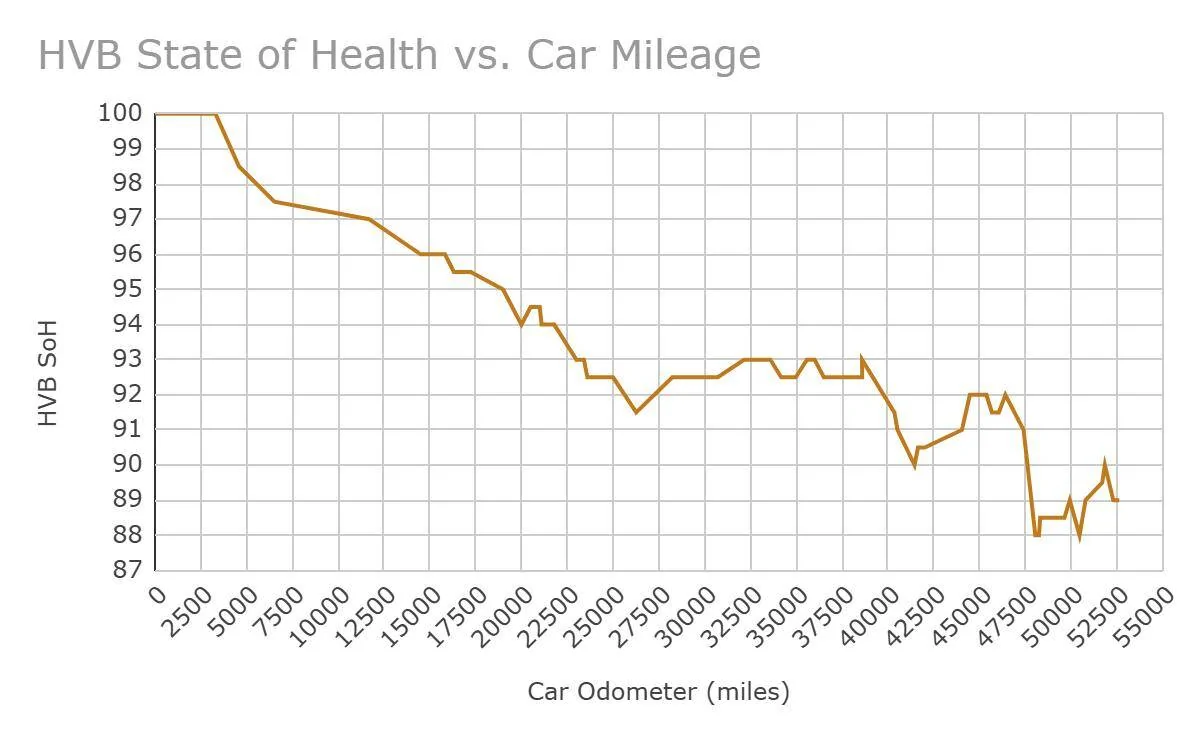
I also compared SoH with odometer mileage. Unfortunately I was not capturing that in my CarScanner data feeds, but until the beginning of October I was using Tronity, which gives me accurate odometer readings until I had to turn it off on 10/10/22 (at 17,659 miles). I really, really miss Tronity, BTW.

After Tronity ended I had to estimate the mileage based on records I recorded in my car maintenance log, which are very few. Today I added the odometer reading to the data I always capture in CarScanner, so going forward I will be able to accurately track SoH (and other data) relative to mileage. And maybe Ford will release an official API so I can turn Tronity back on again!
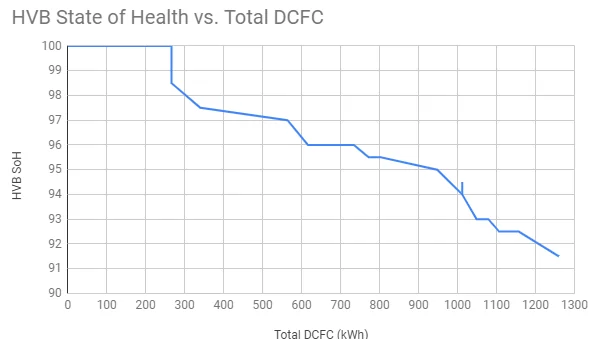
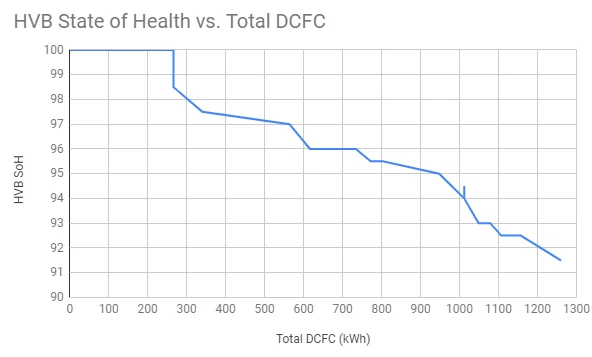
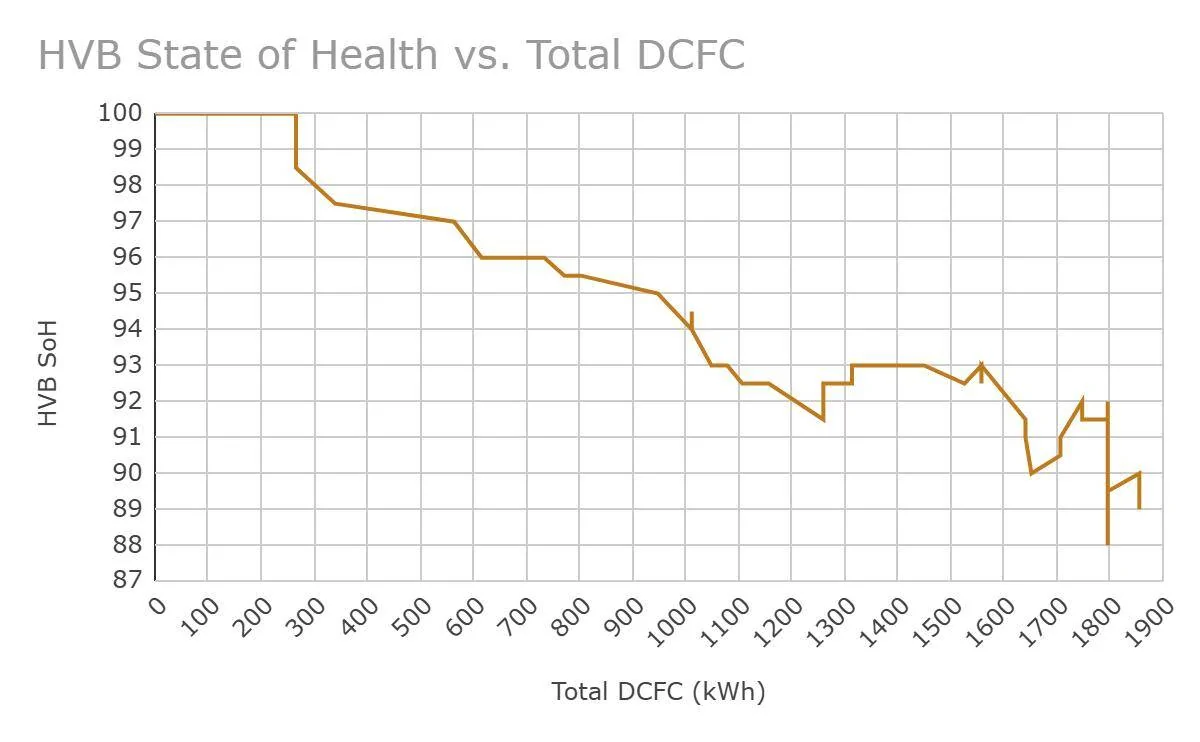
So many people have asked if DCFC could be causing the decline in SoH. So I went through all my charge logs, heavily leveraging Tronity until October, and compared SoH to all the DCFC battery capacity I have added since I got the car new.

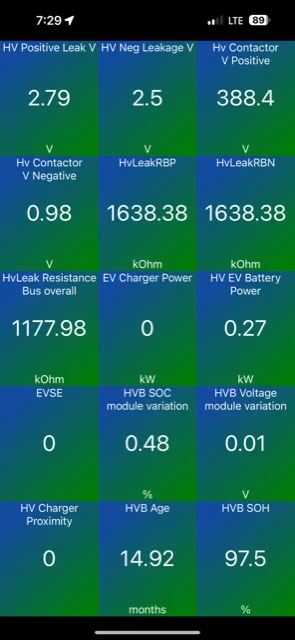
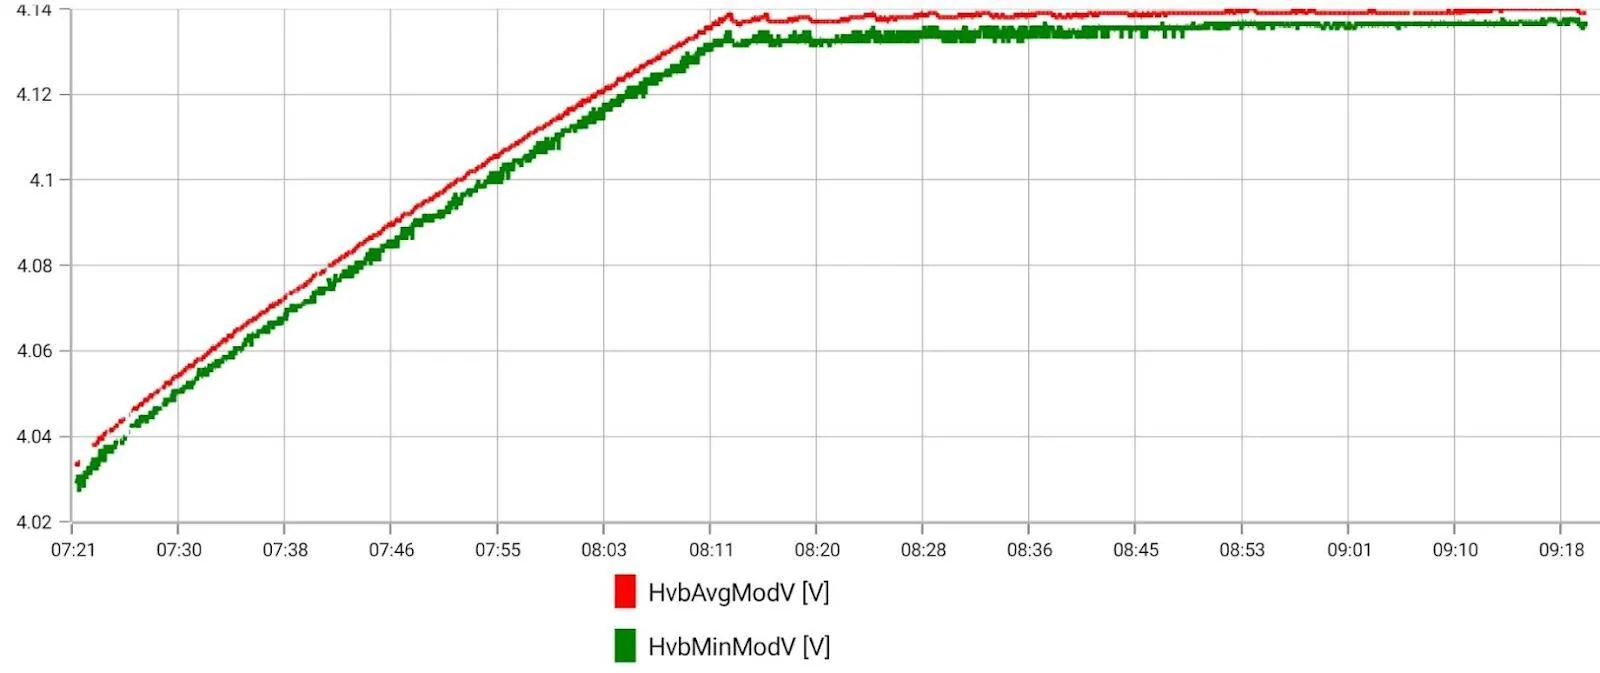
I have also been asked if maybe there is a problem with the battery pack, and so I checked the HVB average voltage with the HVB module minimum voltage, and they are practically the same. Below is a graph of a 100% charge I did this morning, comparing average module voltage with minimum module voltage.

There have been debates in the forum regarding whether or not the SoH is accurate. I think it is. The reason I think so is because at 100% SoCD, the total energy to empty (EtE) is pretty close to what it should be per the SoH.

For my 100% charge today, I was able to get the battery up to 83.78 kWh.
So doing the math, 83.78/91 = 92.07 %. The sensor value for SoH as of today is 91.5%. I suspect the lower SoH number is due to the fact I don’t regularly charge to 100%, so the SoH is a little off. I guess the actual SoH of the battery is what I calculated using EtE.
Another factor to consider is battery temperature. As you can see, the battery is not quite at ideal temperature but it is not cold. So I think I may get an improvement in EtE in the summer. Maybe.
Conclusion:
The SoH appears to be best correlated with mileage, and the worst correlation is with DCFC. I think if I spent the time and pulled together all charging events, instead of just the DCFC ones, we would see a strong correlation with total charging kWh. Obviously every mile that is put on the car requires a charge to get there, so that is why I think mileage correlates well. But I have a ton, literally, of charging events. And after Tronity ended, I only have FordPass as a record source, and it only goes back 30 days. Arrg.
I am very interested to see what others are getting for SoH vs. how many miles are on the car.
Update: 7/9/2023
I will continue to update this section as time progresses. Right now it looks like SoH is best correlated with DCFC, but I doubt that is really the case. As others have stated, age and the normal charging and discharging process will degrade the battery. I still think mileage will end up being the best correlation because you have to charge the car to put miles on it, and I am not tracking total kWh of charging, just DCFC kWh.
SoC has settled at 92.5% and not changed over several months.

(The red bar above is when I took delivery of the car)


Update 12/30/2023
The SoC went up to 93% for a while during the hot weather, but now has settled back down to 92.5%. As of others have said, it appears the deterioration is faster at the beginning, but then slows down as time progresses. At least that is what the data from my car shows so far.
The correlation that seemed to exist with DCFC has gone away. There now seems to be no correlation with any of the factors I am measuring. Does this mean I will stop reporting on this project? Nope! I will keep updating every few months to share with others so it may help with what to expect with your car's battery.
I am very relieved the SoH appears to have stabilized. Hopefully it won't take another turn down over the next few months.

Update 10/20/2024
This is a sad day because the SoH has dropped below 90% for the first time. I am hoping the pattern of dropping down and bouncing back is maintained. I think the drop is related to the colder weather, as the battery has been much colder than it typically is over the past month. It was parked in an unheated parking garage for almost two weeks at the end of September, when it typically in my home garage.
It is parked at home now, but I did travel this week and it was sitting outside when the temps dropped down below 40. It never gets that cold in my home garage.
All that said, I am not happy at all that the SoH is this low.
One additional data point: I charged to 100% a few days ago and the battery got to 83.85 kWh. So with math, that means the SoH should be 83.85/91 = 92%. I am hoping the SoH reading from the BMS comes back up in the next week or two.
From my data, the SoH decline seems most closely related to mileage, but the graph vs. age is pretty similar.
(In the graph below, the red line is the date I took delivery of my MME.)


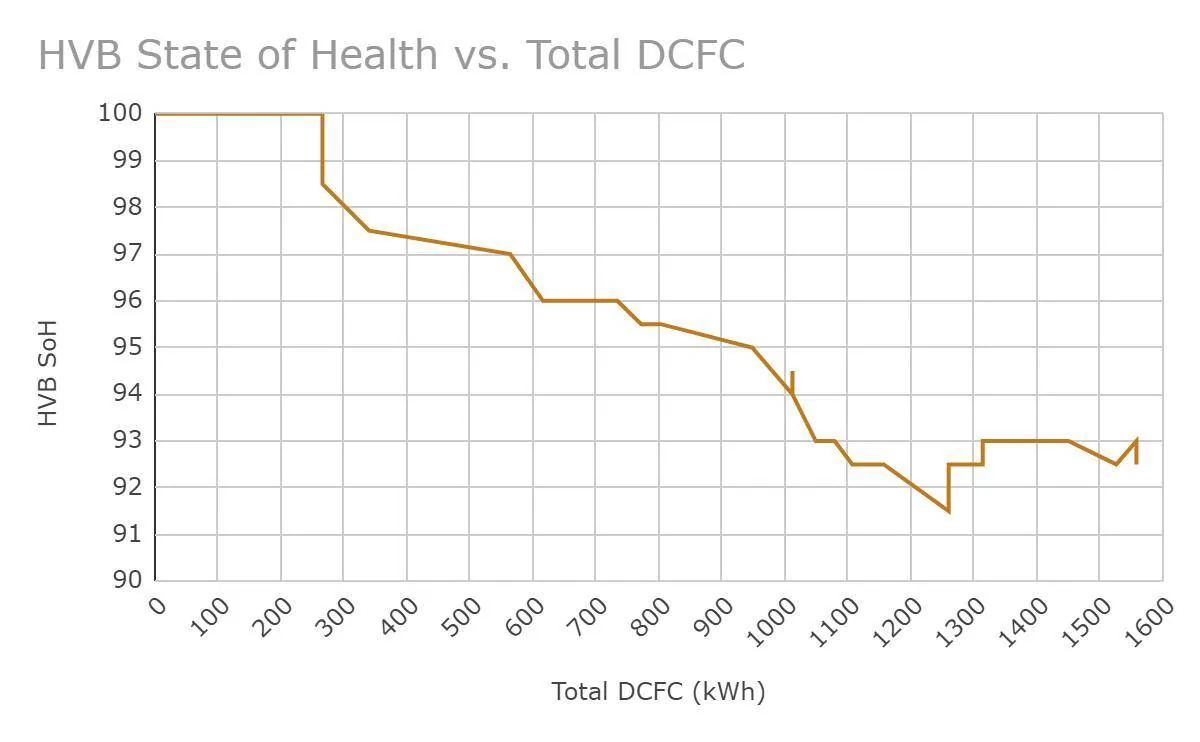
There does not appear to a good correlation with DCFC charges. So this data supports what others have said about DCFC charges: the impact to battery health is not significant compared to slower charging. Charging in general wears out the battery, and of course charging is closely correlated with mileage. The more you drive, the more you have to charge.
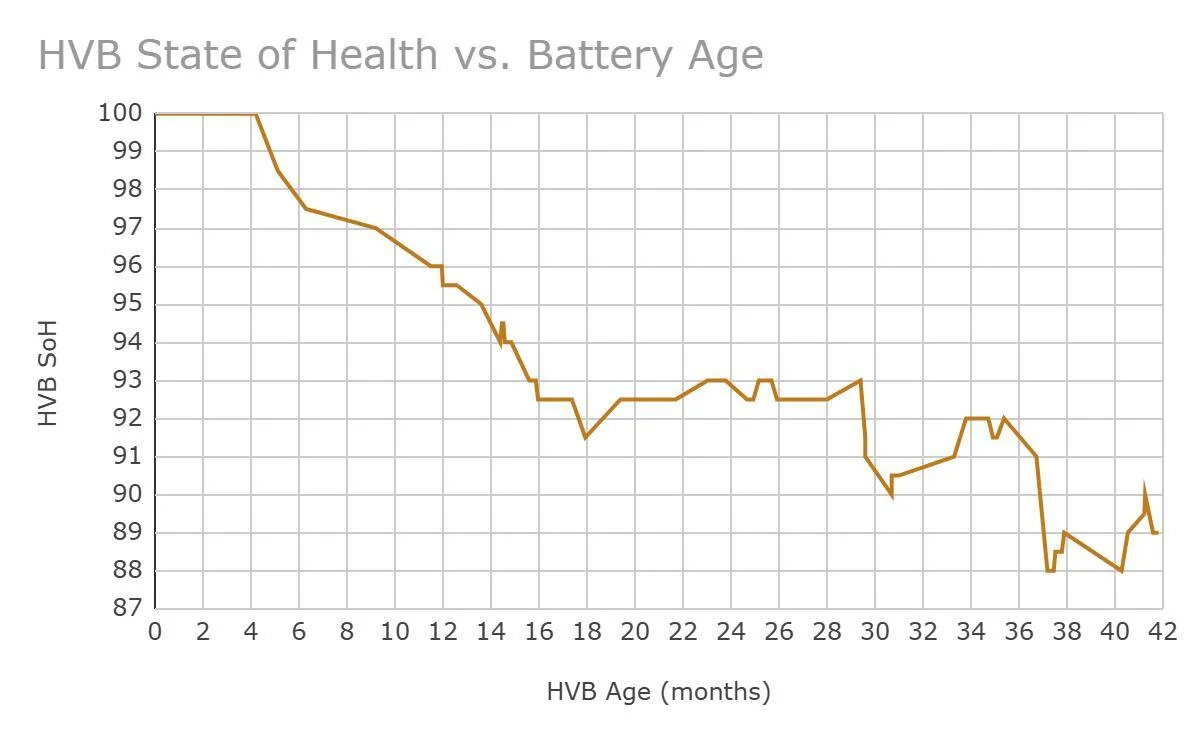
Final Update, as of March 10, 2025
I no longer own my awesome MME, but I wanted to do a final update on the SoH trend since I have CarScanner data up until just before I traded it in.
The final graphs are shown below, and as pointed out previously, the correlation is best with mileage and HVB age. I think my frequent WOT events probably contributed to the decline in health, but I don't have any way to correlate those with the readings.
The good thing to take away from this is that it appears the SoH on my MME was leveling out. It even went up a little bit at the end. I suspect it will hover around 88-89% for quite a while, assuming the new owner doesn't abuse the battery.
Let me know if you have any questions. I am still following this forum, although not quite as active as I was before, I will help you if I can.
Since then I have been mentioning this on the forum in various threads and it seems the SoH of my battery is lower than others. But it could be because I have more miles on the car. So I decided to go through all my old CarScanner data and see if I could track the SoH over time. Luckily I was able to find enough data to get a good trend.
Below the SoH is graphed relative to battery age in months as of today. The red line is the day I took delivery of the car. (Yes, it sat in Mexico for a while.)
I also compared SoH with odometer mileage. Unfortunately I was not capturing that in my CarScanner data feeds, but until the beginning of October I was using Tronity, which gives me accurate odometer readings until I had to turn it off on 10/10/22 (at 17,659 miles). I really, really miss Tronity, BTW.
After Tronity ended I had to estimate the mileage based on records I recorded in my car maintenance log, which are very few. Today I added the odometer reading to the data I always capture in CarScanner, so going forward I will be able to accurately track SoH (and other data) relative to mileage. And maybe Ford will release an official API so I can turn Tronity back on again!
So many people have asked if DCFC could be causing the decline in SoH. So I went through all my charge logs, heavily leveraging Tronity until October, and compared SoH to all the DCFC battery capacity I have added since I got the car new.
I have also been asked if maybe there is a problem with the battery pack, and so I checked the HVB average voltage with the HVB module minimum voltage, and they are practically the same. Below is a graph of a 100% charge I did this morning, comparing average module voltage with minimum module voltage.
There have been debates in the forum regarding whether or not the SoH is accurate. I think it is. The reason I think so is because at 100% SoCD, the total energy to empty (EtE) is pretty close to what it should be per the SoH.
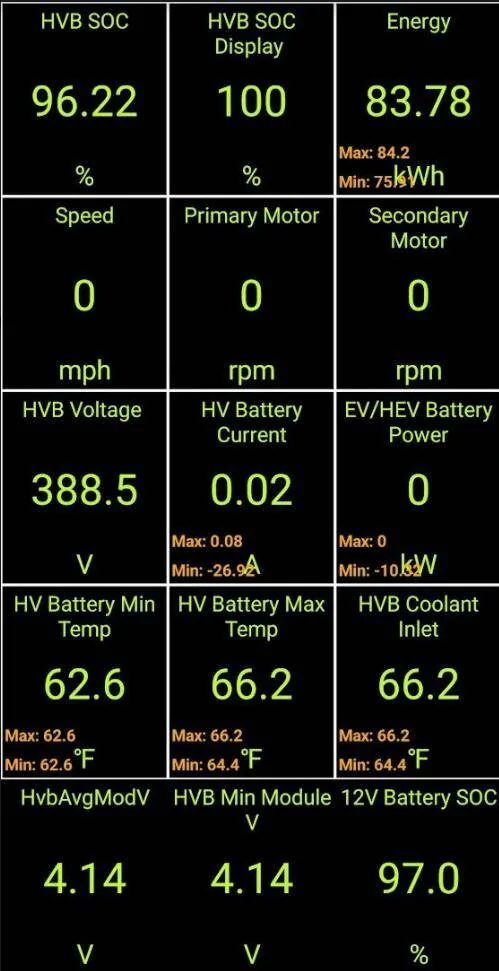
For my 100% charge today, I was able to get the battery up to 83.78 kWh.
So doing the math, 83.78/91 = 92.07 %. The sensor value for SoH as of today is 91.5%. I suspect the lower SoH number is due to the fact I don’t regularly charge to 100%, so the SoH is a little off. I guess the actual SoH of the battery is what I calculated using EtE.
Another factor to consider is battery temperature. As you can see, the battery is not quite at ideal temperature but it is not cold. So I think I may get an improvement in EtE in the summer. Maybe.
Conclusion:
The SoH appears to be best correlated with mileage, and the worst correlation is with DCFC. I think if I spent the time and pulled together all charging events, instead of just the DCFC ones, we would see a strong correlation with total charging kWh. Obviously every mile that is put on the car requires a charge to get there, so that is why I think mileage correlates well. But I have a ton, literally, of charging events. And after Tronity ended, I only have FordPass as a record source, and it only goes back 30 days. Arrg.
I am very interested to see what others are getting for SoH vs. how many miles are on the car.
Update: 7/9/2023
I will continue to update this section as time progresses. Right now it looks like SoH is best correlated with DCFC, but I doubt that is really the case. As others have stated, age and the normal charging and discharging process will degrade the battery. I still think mileage will end up being the best correlation because you have to charge the car to put miles on it, and I am not tracking total kWh of charging, just DCFC kWh.
SoC has settled at 92.5% and not changed over several months.
(The red bar above is when I took delivery of the car)
Update 12/30/2023
The SoC went up to 93% for a while during the hot weather, but now has settled back down to 92.5%. As of others have said, it appears the deterioration is faster at the beginning, but then slows down as time progresses. At least that is what the data from my car shows so far.
The correlation that seemed to exist with DCFC has gone away. There now seems to be no correlation with any of the factors I am measuring. Does this mean I will stop reporting on this project? Nope! I will keep updating every few months to share with others so it may help with what to expect with your car's battery.
I am very relieved the SoH appears to have stabilized. Hopefully it won't take another turn down over the next few months.
Update 10/20/2024
This is a sad day because the SoH has dropped below 90% for the first time. I am hoping the pattern of dropping down and bouncing back is maintained. I think the drop is related to the colder weather, as the battery has been much colder than it typically is over the past month. It was parked in an unheated parking garage for almost two weeks at the end of September, when it typically in my home garage.
It is parked at home now, but I did travel this week and it was sitting outside when the temps dropped down below 40. It never gets that cold in my home garage.
All that said, I am not happy at all that the SoH is this low.
One additional data point: I charged to 100% a few days ago and the battery got to 83.85 kWh. So with math, that means the SoH should be 83.85/91 = 92%. I am hoping the SoH reading from the BMS comes back up in the next week or two.
From my data, the SoH decline seems most closely related to mileage, but the graph vs. age is pretty similar.
(In the graph below, the red line is the date I took delivery of my MME.)
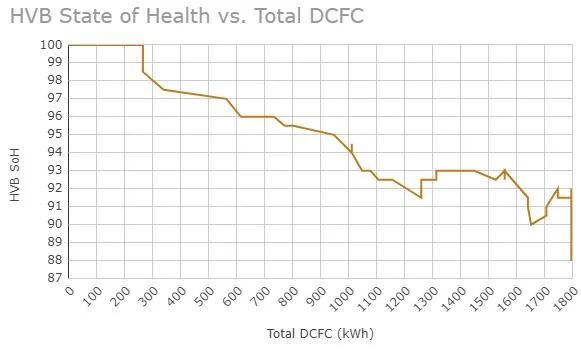
There does not appear to a good correlation with DCFC charges. So this data supports what others have said about DCFC charges: the impact to battery health is not significant compared to slower charging. Charging in general wears out the battery, and of course charging is closely correlated with mileage. The more you drive, the more you have to charge.
Final Update, as of March 10, 2025
I no longer own my awesome MME, but I wanted to do a final update on the SoH trend since I have CarScanner data up until just before I traded it in.
The final graphs are shown below, and as pointed out previously, the correlation is best with mileage and HVB age. I think my frequent WOT events probably contributed to the decline in health, but I don't have any way to correlate those with the readings.
The good thing to take away from this is that it appears the SoH on my MME was leveling out. It even went up a little bit at the end. I suspect it will hover around 88-89% for quite a while, assuming the new owner doesn't abuse the battery.
Let me know if you have any questions. I am still following this forum, although not quite as active as I was before, I will help you if I can.
Sponsored
Last edited: